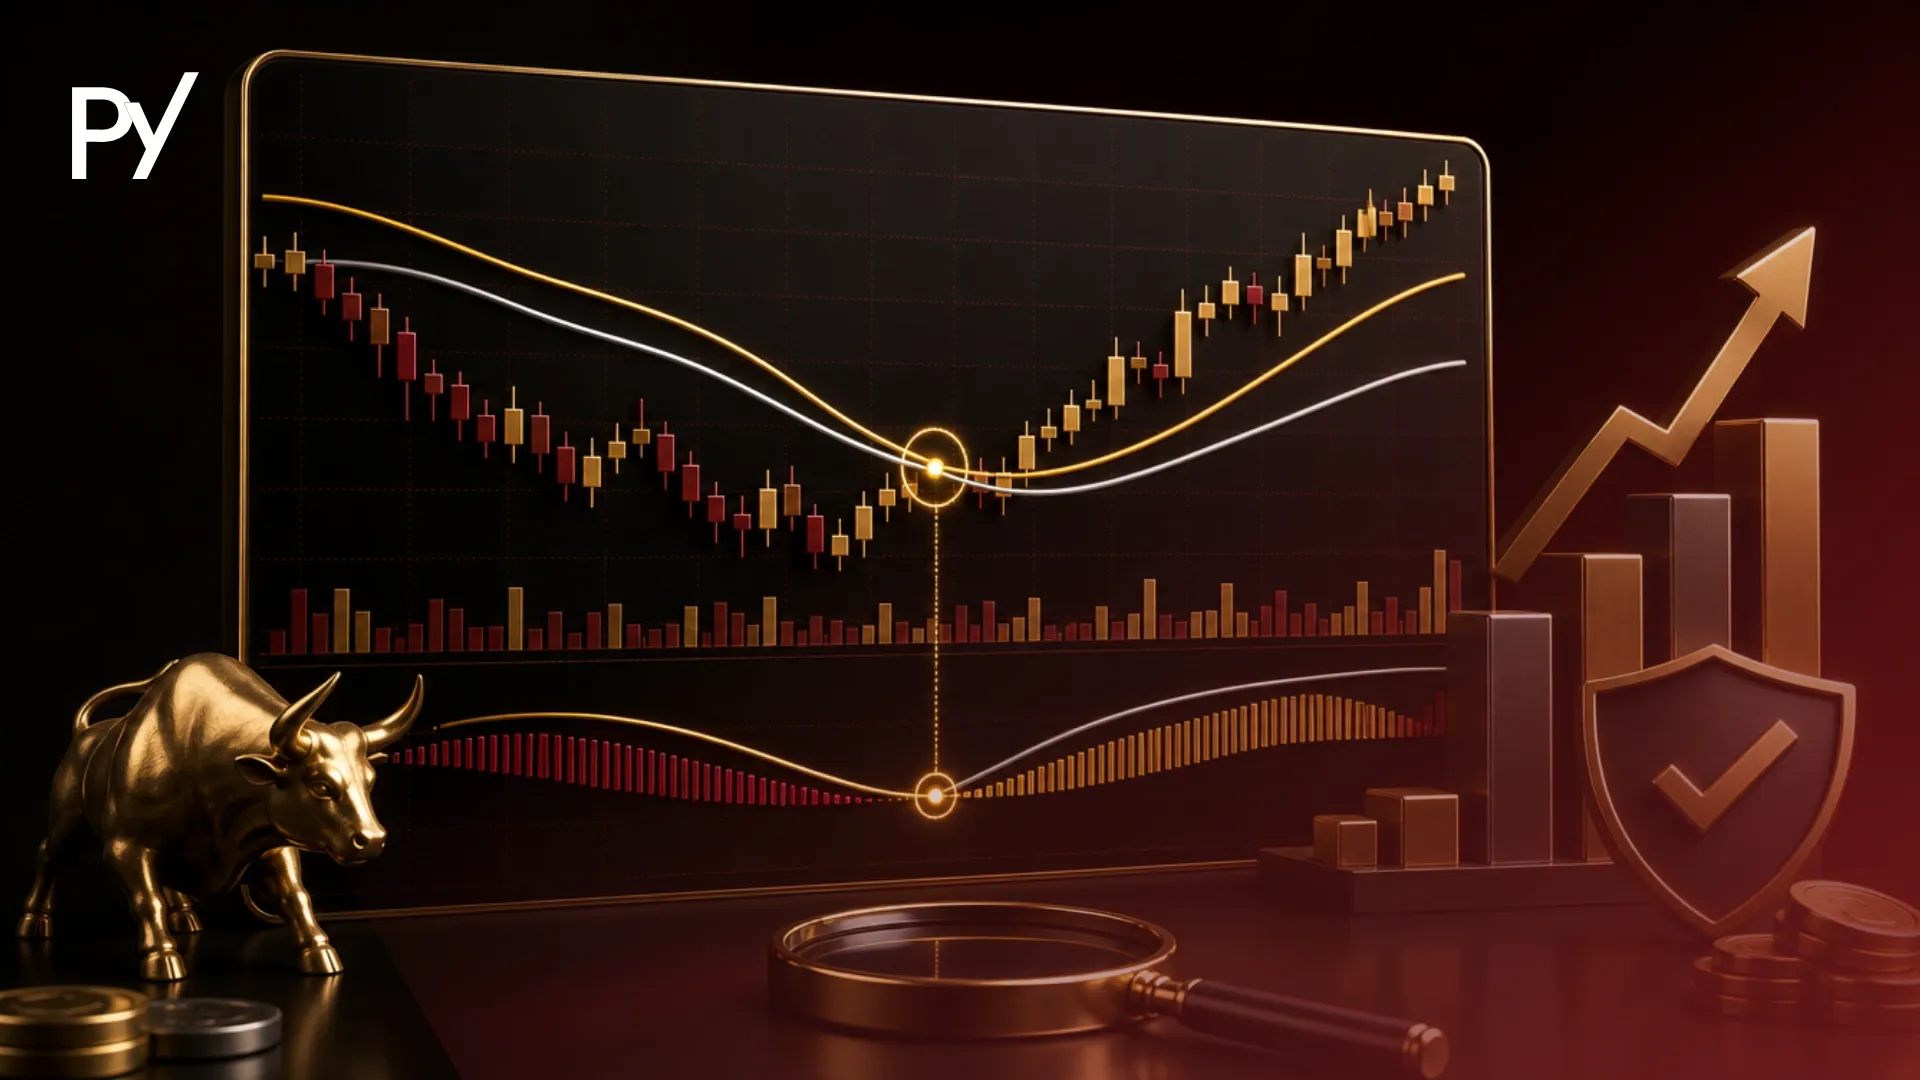

What Is a Golden Cross? Mechanics and the 3-Phase Lifecycle
A golden cross is a lagging technical momentum signal created when a short-term moving average crosses above a long-term moving average, indicating a shift from a prolonged bearish regime to a macro bullish trend.
In standard chart analysis, traders track the 50-period Simple Moving Average (SMA) and the 200-period SMA on Daily or 4-Hour charts. The 50-period SMA calculates the average closing price over the last 50 candles, reflecting medium-term momentum, while the 200-period SMA measures the broader long-term baseline. When the faster 50-period line pierces above the slower 200-period line, it signals mathematically that recent buying pressure is outpacing the historical baseline.

The formation of a golden cross unfolds across three distinct structural phases:
- Phase 1: Downtrend Exhaustion (Accumulation): Price action stops making lower lows and begins consolidating at a bottom. The downward slope of the 50-period moving average flattens out as selling momentum decays.
- Phase 2: The Crossover Event: A surge in buying pressure pushes price upward, causing the 50-period moving average to cross above the 200-period moving average. This event marks the official technical print of the golden cross.
- Phase 3: Trend Continuation & Dynamic Support: The moving averages begin to fan out upward. During subsequent corrective pullbacks, the 50-period and 200-period moving averages often serve as dynamic support levels where buyers re-enter the market.
For funded traders, buying the exact candle where a golden cross prints often leads to immediate frustration. Because moving averages are inherently lagging calculations, price has usually extended far beyond its base before the crossover confirms. Entering late exposes your equity to deep post-breakout pullbacks that can easily breach strict daily drawdown limits. This guide covers how golden cross mechanics work, why buying raw crossovers fails in evaluation accounts, and how to use the setup as a higher-timeframe trend filter instead.
Golden Cross vs. Death Cross: Key Structural Differences
The primary difference between a golden cross and a death cross is directional bias: a golden cross signals macro bullish momentum when the 50-period moving average crosses above the 200-period moving average, while a death cross signals macro bearish momentum when the 50-period drops below the 200-period.
Understanding the structural mirror between these two setups allows traders to apply consistent trend-filtering rules across both long and short market environments.
| Structural Feature | Golden Cross | Death Cross |
|---|---|---|
| Directional Bias | Macro Bullish | Macro Bearish |
| Moving Average Alignment | 50 SMA crosses above 200 SMA | 50 SMA crosses below 200 SMA |
| Market Phase Context | Exhaustion of downtrend / Accumulation breakout | Exhaustion of uptrend / Distribution breakdown |
| Primary Role in Prop Trading | Long-bias trend filter for lower-timeframe buys | Short-bias trend filter for lower-timeframe sells |
| Dynamic Support / Resistance | Moving averages act as dynamic support on dips | Moving averages act as dynamic resistance on rallies |
| Primary Drawdown Risk | Buying extended tops into post-breakout retracements | Shorting extended bottoms into post-breakout rallies |
Both patterns function as macro trend filters rather than standalone entry triggers. Attempting to trade either signal without secondary confirmation exposes trading capital to severe slippage and mean-reversion pullbacks.
The Lagging Signal Drawdown Trap in Prop Trading
The lagging nature of moving averages creates a drawdown trap for prop traders because the crossover print occurs well after price has made a significant directional move, resulting in poor risk-to-reward entry points.
Traditional retail trading literature often recommends entering a market order the moment the golden cross prints, with a stop-loss placed safely below the 200-day moving average. In foreign exchange, commodities, or index futures, the distance between the current market price and the 200-day SMA at the time of a crossover is frequently 5% to 15% away.
In a retail trading account with no fixed risk limits, holding through a deep drawdown while waiting for the long-term trend to resume might be acceptable. In a prop trading evaluation or funded account, however, rigid risk parameters apply:
- Daily Drawdown Limits: Most evaluation models enforce a 4% to 5% maximum daily loss limit based on balance or trailing equity.
- Maximum Overall Drawdown: Account loss limits are typically capped at 8% to 10% total equity.
- Capital Protection Constraints: A single trade entered on a raw golden cross print with a wide stop below the 200-day SMA can breach the maximum daily drawdown on a single post-breakout retracement candle.
Furthermore, during sideways or range-bound markets, moving averages continuously weave back and forth. This generates repeated false signals—known as whipsaws—where a golden cross prints right before price reverses sharply downward. A funded trader attempting to buy every crossover in a consolidating market will experience consecutive losses that quickly trigger account termination rules.
How Funded Traders Safely Trade a Golden Cross
Funded traders safely trade a golden cross by using the crossover strictly as a higher-timeframe directional bias filter while timing low-risk entries on lower timeframes using structural pullbacks and technical confluence.
Rather than treating the 50/200 crossover as an automated market entry order, successful prop traders separate higher-timeframe bias from lower-timeframe execution.

1. Macro Filter, Micro Entry
When a golden cross forms on the Daily or 4-Hour timeframe, establish a strict long-only bias on your watchlist. Instead of buying immediately, drop down to the 15-Minute or 1-Hour chart and wait for price to retrace toward key structural levels, such as:
- Local demand zones or order blocks created during the breakout impulse.
- Prior horizontal resistance levels that have flipped into new support.
- High-confluence Fibonacci retracement zones (such as the 50% or 61.8% levels).
Executing on lower-timeframe structural pullbacks allows you to place a tight stop-loss below local structure, keeping your dollar risk well under 1% of account capital while maintaining a high risk-to-reward ratio.
2. Multi-Indicator Confluence
Never rely on moving average lines in isolation. Combine golden cross bias with broader technical indicators to filter out low-probability setups:
- Momentum Confirmation: Verify that the Relative Strength Index (RSI) holds above the 50 midpoint during pullbacks, confirming that buyers retain control.
- Volume Expansion: Ensure the initial crossover impulse was accompanied by rising volume, signaling institutional participation rather than low-liquidity retail drift.
3. Volatility Expansion Rules
To avoid getting trapped in sideways whipsaws, pair your crossover analysis with a structured Bollinger Bands strategy. Waiting for a volatility squeeze to expand alongside a moving average alignment provides clear confirmation that the market is transitioning from consolidation into an active trending phase.
Risk Management & Execution Rules for Crossover Setups
Managing risk on golden cross trades requires placing tight structural stop-losses below recent swing lows rather than arbitrary moving average lines, ensuring individual trade risk stays strictly within 0.5% to 1.0% of total account capital.
To protect evaluation accounts against sudden mean-reversion spikes, follow a disciplined execution checklist:
- Position Sizing Calculation: Determine your position size based on the exact pip or point distance from your lower-timeframe entry to your structural stop-loss. Never use static lot sizes.
- Structural Stop Placement: Place your stop-loss invalidation point just below the most recent local swing low on your execution timeframe. If price breaks this level, the immediate intraday bullish structure is invalid, regardless of where the 200-day SMA sits.
- Pre-Planned Profit Targets: Identify major higher-timeframe supply zones or historical resistance levels overhead. Bank partial gains (e.g., 50% of the position) at a 1:1.5 or 1:2 risk-to-reward ratio to secure realized profit against daily trailing drawdown rules.
Common Golden Cross Mistakes to Avoid
The most frequent golden cross mistakes involve treating the indicator as an automated buy signal, ignoring overhead market structure, and over-leveraging during choppy market conditions.
- Chasing the Crossover Print (FOMO Entries): Placing a market order right as the 50 SMA crosses the 200 SMA usually means buying at the climax of an overextended impulse move, right before a deep corrective retest.
- Ignoring Overhead Resistance: Buying a golden cross that prints directly below a major weekly resistance block or key liquidity pool invites aggressive short-sellers to drive price back down into your stop loss.
- Trading Crossovers in Sideways Markets: Taking crossover signals while price action is bound inside an established horizontal range leads to repeated losses as the moving averages repeatedly cross without directional follow-through.
- Neglecting High-Impact News Events: Holding aggressive breakout positions across major economic data releases (such as US Non-Farm Payrolls or inflation reports) exposes your account to sudden spread expansion and execution slippage that can breach firm drawdown caps.
Conclusion
Trading a golden cross successfully in a funded account environment requires shifting your perspective from chasing breakout prints to executing disciplined, structural entries. By treating the 50/200 moving average crossover as a macro trend filter on higher timeframes, you eliminate the temptation to buy overextended price moves. Coupling this directional bias with lower-timeframe structural pullbacks, strict position sizing, and proper multi-indicator confirmation allows you to capture sustained bullish trends while helping you manage exposure against your daily and trailing drawdown limits — though drawdown risk can never be fully eliminated.