
In a funded account, this pattern presents a unique execution dilemma: the sheer size of the fourth "strike" candle requires an unusually wide stop-loss. If you default to fixed lot sizes instead of dynamic risk calculations, a single invalidation can instantly breach your daily loss limit. This guide breaks down the structural mechanics, historical reversal statistics, and the exact position-sizing math needed to size the setup within strict prop firm rules.

Three Line Strike: Anatomy, Execution, and Funded Account Risk
On this pageWhat Is the Three Line Strike Pattern?
Direct Answer
The three-line strike is a rare four-candle price action formation where three consecutive trending bars are completely engulfed by an expansive fourth counter-trend candle. While traditionally cataloged as a trend continuation pattern, Bulkowski’s backtests on daily stock data suggest it often acts as a reversal signal. You must also dynamically reduce position sizes to protect your daily loss limit.
What Is the Three Line Strike Pattern?
The three-line strike is a four-bar candlestick formation where a brief, orderly trend is abruptly terminated and reversed by an expansive counter-trend candle. When evaluating the pattern’s structure in practical trading, you may be seeing an aggressive clash between retail trend-followers and larger market participants absorbing volume.
The pattern traces back to classical Japanese technical analysis, where chartists viewed the formation as a temporary capitulation or "strike" against the prevailing trend before the dominant move resumed. In modern markets, however, such an aggressive engulfing bar can mark a liquidity sweep (a sharp move that triggers resting stop orders). The first three candles represent steady, predictable progress: either three consecutive bearish candles printing lower lows or three bullish candles printing higher highs. Retail participants view this steady progression as confirmation of momentum, entering breakout trades and clustering their defensive stop orders tightly behind each preceding bar.
The fourth candle changes the market structure entirely. It opens at or beyond the close of the third bar, lulling late trend-followers into a false sense of security, before violently reversing through the entire range of the prior three sessions. By closing beyond the opening price of the very first candle in the sequence, the strike candle can trigger cascading stop-loss orders from trapped traders. Understanding this structural shift is fundamental to navigating broader candlestick patterns inside capitalized prop firm accounts, where sudden liquidity sweeps often dictate whether your daily loss limit remains intact.
Three Line Strike Explained: Anatomy, OHLC Rules, and Market Mechanics
A valid three-line strike requires strict open-high-low-close (OHLC) alignment across all four candles to ensure the final bar represents genuine institutional absorption rather than ordinary volatility. When you review its mechanical chart parameters, the pattern splits into two distinct variations: bullish and bearish.
Bullish Three Line Strike Anatomy
The bullish version forms within an established downtrend and develops across four distinct phases:
- Candle 1: A distinct bearish candle with a lower close, reinforcing the downward trend.
- Candle 2: A second bearish candle that opens within or below the body of Candle 1 and prints a new lower close.
- Candle 3: A third bearish candle that opens within or below the body of Candle 2 and closes lower, completing a sequence of three consecutive declining bars (often resembling a Three Black Crows formation).
- Candle 4 (The Strike Bar): Opens at or below the close of Candle 3, completely reverses direction, and surges aggressively upward. To be valid, it must close strictly above the opening price of Candle 1, fully erasing the combined three-bar decline in a single period.
Bearish Three Line Strike Anatomy
The bearish version forms within an established uptrend and mirrors the mechanics of its bullish counterpart:
- Candle 1: A distinct bullish candle that closes higher, confirming upward momentum.
- Candle 2: A second bullish candle with an open within or above Candle 1's body and a higher close.
- Candle 3: A third bullish candle that continues the sequence with a higher open and a new higher close (similar to Three White Soldiers).
- Candle 4 (The Strike Bar): Opens at or above the close of Candle 3, rejects the highs violently, and plunges downward. It must close strictly below the opening price of Candle 1, completely engulfing the preceding three-session advance.
The Continuation vs. Reversal Debate
There is a gap between traditional technical literature and quantitative empirical data regarding how this pattern behaves. Classical Japanese charting manuals cataloged the pattern as a continuation setup. The theory suggested that the outsized fourth bar was merely profit-taking or an aggressive liquidity shakeout, after which the original trend would reassert itself with renewed vigor.
Modern quantitative research presents a different picture. In Thomas Bulkowski’s historical testing documented in the Encyclopedia of Candlestick Charts (2008), the three-line strike with three falling candles (Bulkowski labels it the bearish three-line strike) acted as a bullish reversal 84% of the time on daily stock data, a result he notes rests on a small number of samples. Bulkowski ranked it among the highest-performing candlestick setups for raw directional follow-through.
However, you must not mistake historical equity backtests for an infallible edge in a modern prop firm environment. Bulkowski’s figures were compiled using historical daily stock data without accounting for leveraged intraday spreads, execution slippage, or funding constraints. Clean formations are exceptionally scarce on any timeframe. If you attempt to force this pattern onto 1-minute or 5-minute charts to pass a challenge, spread costs and market noise quickly erode any statistical advantage.
Why the Three Line Strike Matters for Funded Traders
The pattern carries unique hazards for prop firm traders because the outsized fourth bar distorts standard risk-to-reward ratios and threatens tight daily loss thresholds. In a standard retail brokerage account, an unexpectedly large candle simply means waiting longer for a target or accepting a wider swing. In a funded account, an uncalibrated position size on an oversized bar can terminate your evaluation in seconds.
The "Wide Strike Candle" Risk Trap
Because the fourth candle must completely engulf the bodies and ranges of the prior three sessions, it is by definition an unusually long momentum candle. In foreign exchange or futures markets, this strike bar often spans two to four times the average true range (ATR) of typical bars on that timeframe.
If an average 15-minute EUR/USD candle spans 12 pips, a valid strike bar might cover 35 to 45 pips. If your standard structural trade execution places a protective stop-loss just beyond the extreme high or low of the signal candle, your required stop distance suddenly expands from 15 pips to 45 pips.
Drawdown Limit Sensitivity
Most prop evaluation models enforce two non-negotiable risk barriers:
- Maximum Daily Loss: Typically 4% to 5% of starting or equity-based capital.
- Maximum Overall Drawdown: Typically 8% to 10% (often static or trailing).
Consider a $100,000 challenge account where your daily loss limit is 4% ($4,000), and your target risk per setup is 1% ($1,000). If you trade using a fixed-lot habit, such as automatically executing 5 lots on every trade, a standard 15-pip stop risks $750, well within your daily allowance. However, if you execute those same 5 lots on this setup requiring a 45-pip stop, your actual dollar risk rises to $2,250.
A single pattern failure, combined with minor intraday slippage, will consume more than half of your daily loss buffer on one trade. If you experience a secondary loss earlier in the session, that oversized stop will trigger an immediate account breach and forfeit your challenge fee.
Spread Expansion and Execution Slippage
The rapid momentum that creates the fourth candle often coincides with high-impact economic news releases, session opens, or major order-book imbalances. During these high-velocity moves, liquidity providers widen their bid-ask spreads significantly.
When you enter via a market order directly on the close of the strike candle, you are executing precisely when the spread is widest and liquidity is thinnest. On CFD prop feeds, spread markups can expand a typical 0.5-pip spread to 3 or 4 pips during expansive momentum bars. Furthermore, slippage on market fills frequently pushes your actual entry several ticks beyond the candle's close, worsening your effective risk-to-reward ratio before the market even moves.
Execution Strategies Under Prop Challenge Rules
Trading this pattern inside a funded account requires dynamic position sizing and selective entry confirmation to prevent single-trade drawdown breaches. You cannot trade this setup with fixed volume; every trade must be mechanically calibrated against the pip span of the fourth bar.
Dynamic Position Sizing Formula
To safeguard your funded account, your lot size must always be a function of your maximum monetary risk divided by the pattern’s specific invalidation distance.
Follow this three-step sizing protocol before placing an order:
- Define Dollar Risk Limit: Never exceed 0.5% to 1.0% of your current account balance on an individual setup. On a $100,000 account, a 0.75% risk parameter establishes a hard dollar cap of $750.
- Measure Structural Stop Distance: Measure the exact distance from your planned entry point to the structural invalidation level (1 to 2 pips beyond the extreme wick of the strike candle). If entry is at 1.0850 and the invalidation point sits at 1.0810, your stop distance is 40 pips.
- Calculate Executable Lot Size:
Using a standard EUR/USD pip value of $10 per lot:
Lot Size = Maximum Dollar Risk ÷ (Stop Distance (pips) × Pip Value per Lot)
Lot Size = $750 ÷ (40 × $10) = $750 ÷ $400 ≈ 1.87 lots
If you previously traded 4 or 5 standard lots on tighter chart formations, dynamic sizing forces you to scale back to about 1.87 lots. Your planned risk stays at $750, which helps preserve your daily loss cushion if the pattern fails, although slippage and gaps can push the actual loss above $750.
Entry Methodologies: Breakout vs. Retracement
Because entering at the close of an expansive bar damages your risk-to-reward profile, experienced prop traders deploy one of two refined entry tactics:
- Method A (Breakout Entry with Confirmation): Instead of entering on the close of Candle 4, you wait for Candle 5 to open and break beyond the extreme high (for bullish) or low (for bearish) of the strike candle. This confirms that follow-through momentum is genuine before capital is committed. Place your stop-loss either at the midpoint of Candle 4 (if momentum is strong) or just beyond its extreme wick.
- Method B (The 50% Body Retracement Entry): Large momentum candles frequently see an immediate, short-term pullback as intraday scalpers take quick profits. By placing a limit order at the 50% Fibonacci retracement level of the strike candle's body, you accomplish two critical objectives: you shrink your stop-loss distance (often by 40% to 50%) and raise your potential risk-to-reward ratio by roughly 1.7 to 2 times for the same target. If the market continues without filling your retracement limit, you simply let the trade go without incurring risk.
Structural Comparison: Three Line Strike vs. Rising Three Methods
Traders frequently confuse this pattern with other multi-candle continuation setups, most notably the rising three methods. Understanding how their structures diverge is essential for correct trade classification.
| Structural Feature | Three Line Strike (Bullish) | Rising Three Methods |
|---|---|---|
| Total Candle Count | 4 candles | 5 candles |
| Preceding Context | 3 small bearish candles | 1 large bullish candle |
| Core Structure | 1 massive bullish candle engulfing prior 3 | 3 small bearish candles contained inside Bar 1 |
| Final Candle Role | The expansive fourth bar creates the setup | A fifth bullish candle breaks above Bar 1's high |
| Behavioral Role | High-velocity reversal (empirically) | Trend continuation |
| Stop-Loss Footprint | Exceptionally wide (spans 3 prior bars) | Compact (anchored to Bar 1 or Bar 5 low) |
| Prop Risk Profile | Severe drawdown risk if uncalibrated | Predictable risk with standard lot sizing |
Common Traps That Blow Funded Accounts
Risk execution that violates rigid prop firm parameters can end an evaluation even when the pattern is valid. Recognizing these behavioral traps will protect your evaluation fees.
Trap 1: The Fixed-Lot Habit
A common operational error is failing to adjust position size to accommodate the wide strike candle. Prop accounts do not reward static position sizing. If your daily loss limit is $2,000, taking a 50-pip stop with your usual lot size leaves zero room for adverse market variance. If the next candle wicks against you before reversing, your prop firm's automated risk system can close your positions and disable your account.
Trap 2: Overleveraging on the "84% Win Rate" Myth
Retail trading forums frequently parade Bulkowski’s ~84% reversal figure as proof that this pattern is a mechanical money-maker. Traders fall into confirmation bias, assuming that an 8-in-10 win rate justifies risking 2% or 3% of their account balance.
No candlestick pattern guarantees future price trajectory. A cluster of two consecutive failed strikes at 3% risk will instantly breach a 5% maximum daily loss rule. Treat the pattern as a conditional framework that offers an edge only when aligned with higher-timeframe support, resistance, and liquidity pools.
Trap 3: Forcing Low-Timeframe Setups
Because valid four-candle strikes appear infrequently on 4-hour and daily charts, impatient traders drop down to 1-minute or 5-minute charts to hunt for the pattern.
On ultra-low timeframes, what appears to be a valid setup is often nothing more than random spread noise, broker price-feed smoothing, or minor algorithmic rebalancing. Trading high-frequency strikes on low timeframes multiplies your commission costs, subjects your fills to bid-ask slippage, and rapidly degrades your challenge equity curve.
Trap 4: Violating Prop Firm Consistency Rules
Several prop firms enforce consistency rules that mandate no single trading day or single trade can account for more than 30% to 50% of your total profit target. Because the strike candle is a high-momentum pattern, traders who hit an outsized win often find themselves penalized if that single trade generates the vast majority of their Phase 1 target.
Managing your profit extraction and scaling out in partial increments ensures that your performance metrics remain fully compliant with your firm's evaluation terms.
Conclusion
The three-line strike can signal aggressive institutional absorption, but its sheer size makes it inherently dangerous for undercapitalized or undisciplined traders. Surviving in a funded account requires you to prioritize capital preservation over raw chart patterns. By abandoning fixed lot sizes, dynamically calculating position volume based on the strike bar's pip distance, and waiting for confirmation or retracements, you can trade high-velocity price action with risk sized to fit your daily loss limits, although no method removes the chance of a breach.
FAQ
How often does the three-line strike pattern appear on price charts?
Clean, textbook three-line strike patterns are exceptionally rare across major financial markets. Because of this scarcity, waiting for clean daily or 4-hour setups requires significant patience, and attempting to force the pattern onto 1-minute or 5-minute charts frequently exposes traders to market noise and execution slippage.
What timeframe is best for trading the three line strike in a prop challenge?
We would favor the 1-hour and 4-hour charts for trading this pattern under prop firm evaluation rules. These intermediate timeframes provide sufficient structural significance to reduce false engulfing signals while keeping the fourth candle's pip span manageable. Trading the pattern on timeframes below 15 minutes is dangerous because spread widening, commission drag, and minor liquidity grabs corrupt pattern reliability and threaten tight daily loss limits.
Can you use technical indicators to confirm a three-line strike?
Yes, pairing the pattern with volume and momentum indicators can improve trade qualification. An above-average volume surge on the fourth strike candle may point to institutional absorption, while volume divergence across the first three candles can signal trend exhaustion. Additionally, checking whether the fourth candle's extreme taps into an oversold or overbought reading on the Relative Strength Index (RSI) helps confirm whether a reversal impulse has sufficient momentum to follow through.
How does the three-line strike differ from an engulfing candlestick?
While a standard bullish or bearish engulfing pattern consists of just two candles, where the second bar engulfs the single immediately preceding bar, the three-line strike is a four-candle formation. In a three-line strike, the fourth bar must close beyond the opening price of the first candle, engulfing the bodies of the prior three consecutive trending candles. This makes the three-line strike structurally rarer, and it may reflect a more violent liquidity sweep.
Where should profit targets be set when trading a three-line strike?
When executing this pattern, profit targets should align with structural market liquidity rather than arbitrary fixed ratios. A practical approach is placing your first take-profit at the origin or extreme high/low of the first candle in the four-bar sequence, targeting an initial 1:1 or 1:1.5 return, which is not guaranteed. Secondary targets can be trailed toward major swing levels or untested order blocks (zones where large orders were previously placed) on higher timeframes to seek larger gains, although the open position still carries risk until it closes.
Disclaimer
This guide was written with AI assistance, reviewed for accuracy by the Proptary editorial team, and kept up to date. It’s for education only, not financial advice. Prop trading and the derivatives markets carry a significant risk of loss, and past performance is not a guarantee of future results. Consider your own situation and consult a licensed advisor before you trade.
PT
Proptary Team
Firm reviews, rule explainers, payout verification
Proptary editorial team independently reviews prop trading firms, verifies payouts, and explains the rules that decide who keeps an account. We disclose affiliate relationships and publish methodology for every score.
Related articles

What Is a Fair Value Gap? How to Trade It Without Blowing Your Funded Account
Learn how a fair value gap works and how to trade imbalances safely in funded accounts. Read the full guide.
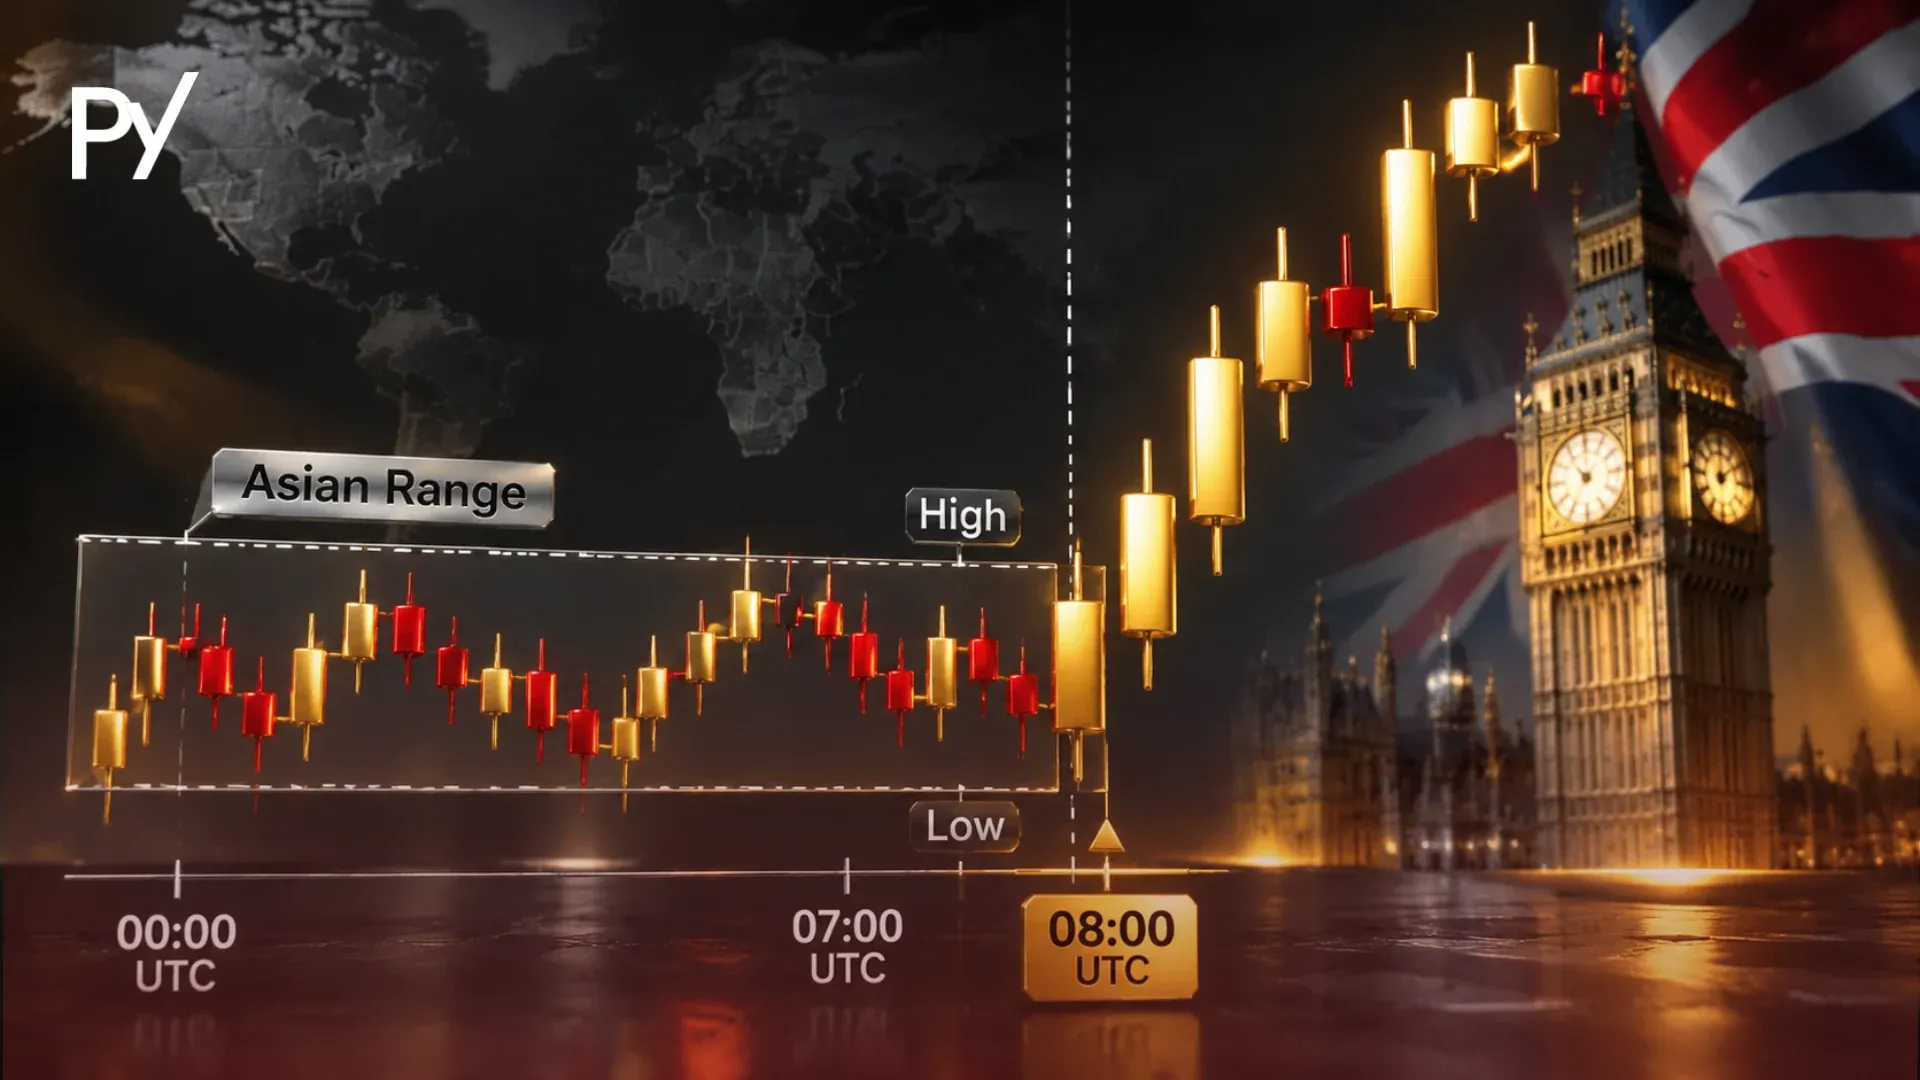
The London Breakout Strategy: How to Trade the European Open
Learn the london breakout strategy to trade the European open and protect prop drawdown. Read the full guide.
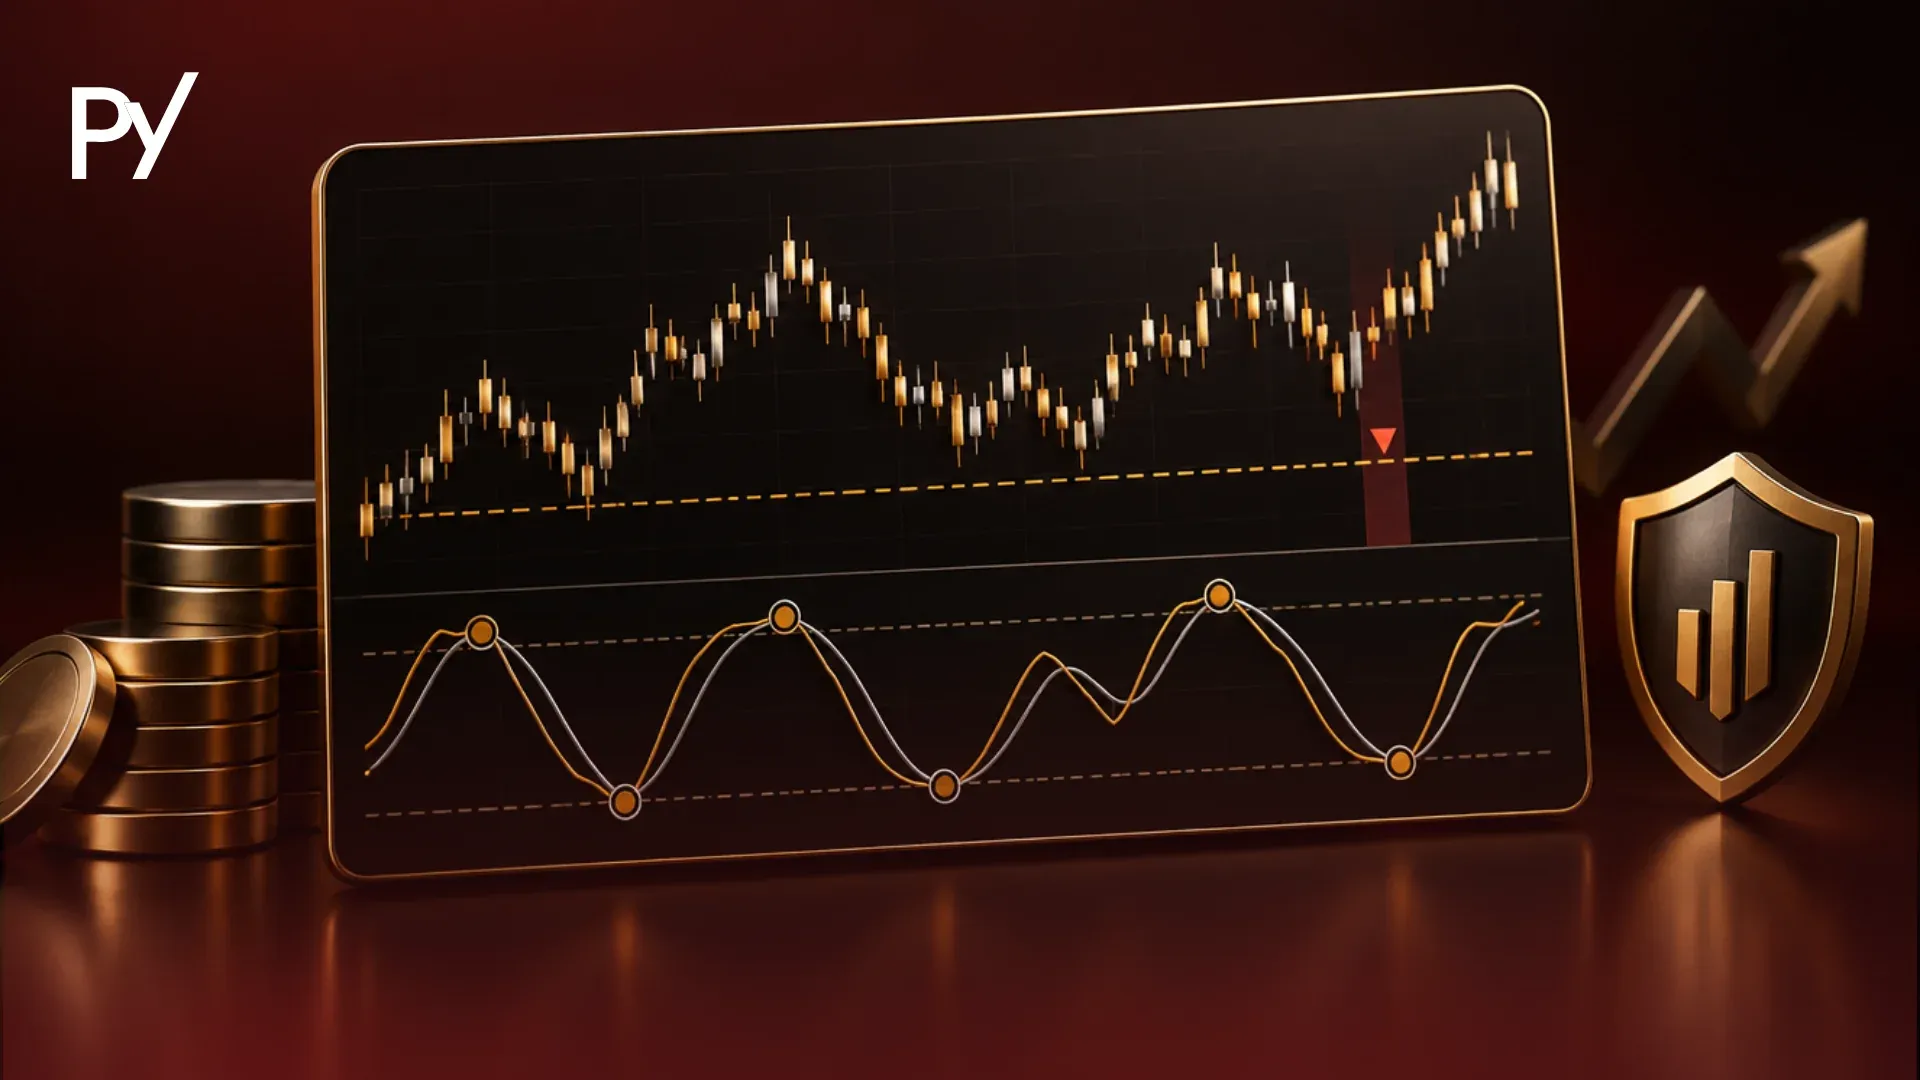
Stochastic Oscillator Strategy: How Funded Traders Time Pullbacks While Managing Drawdown Risk
Learn how a stochastic oscillator strategy helps funded traders time pullbacks safely. Read the full guide.