
What Is Drawdown in Trading? Mechanics, Formulas, and Prop Firm Traps
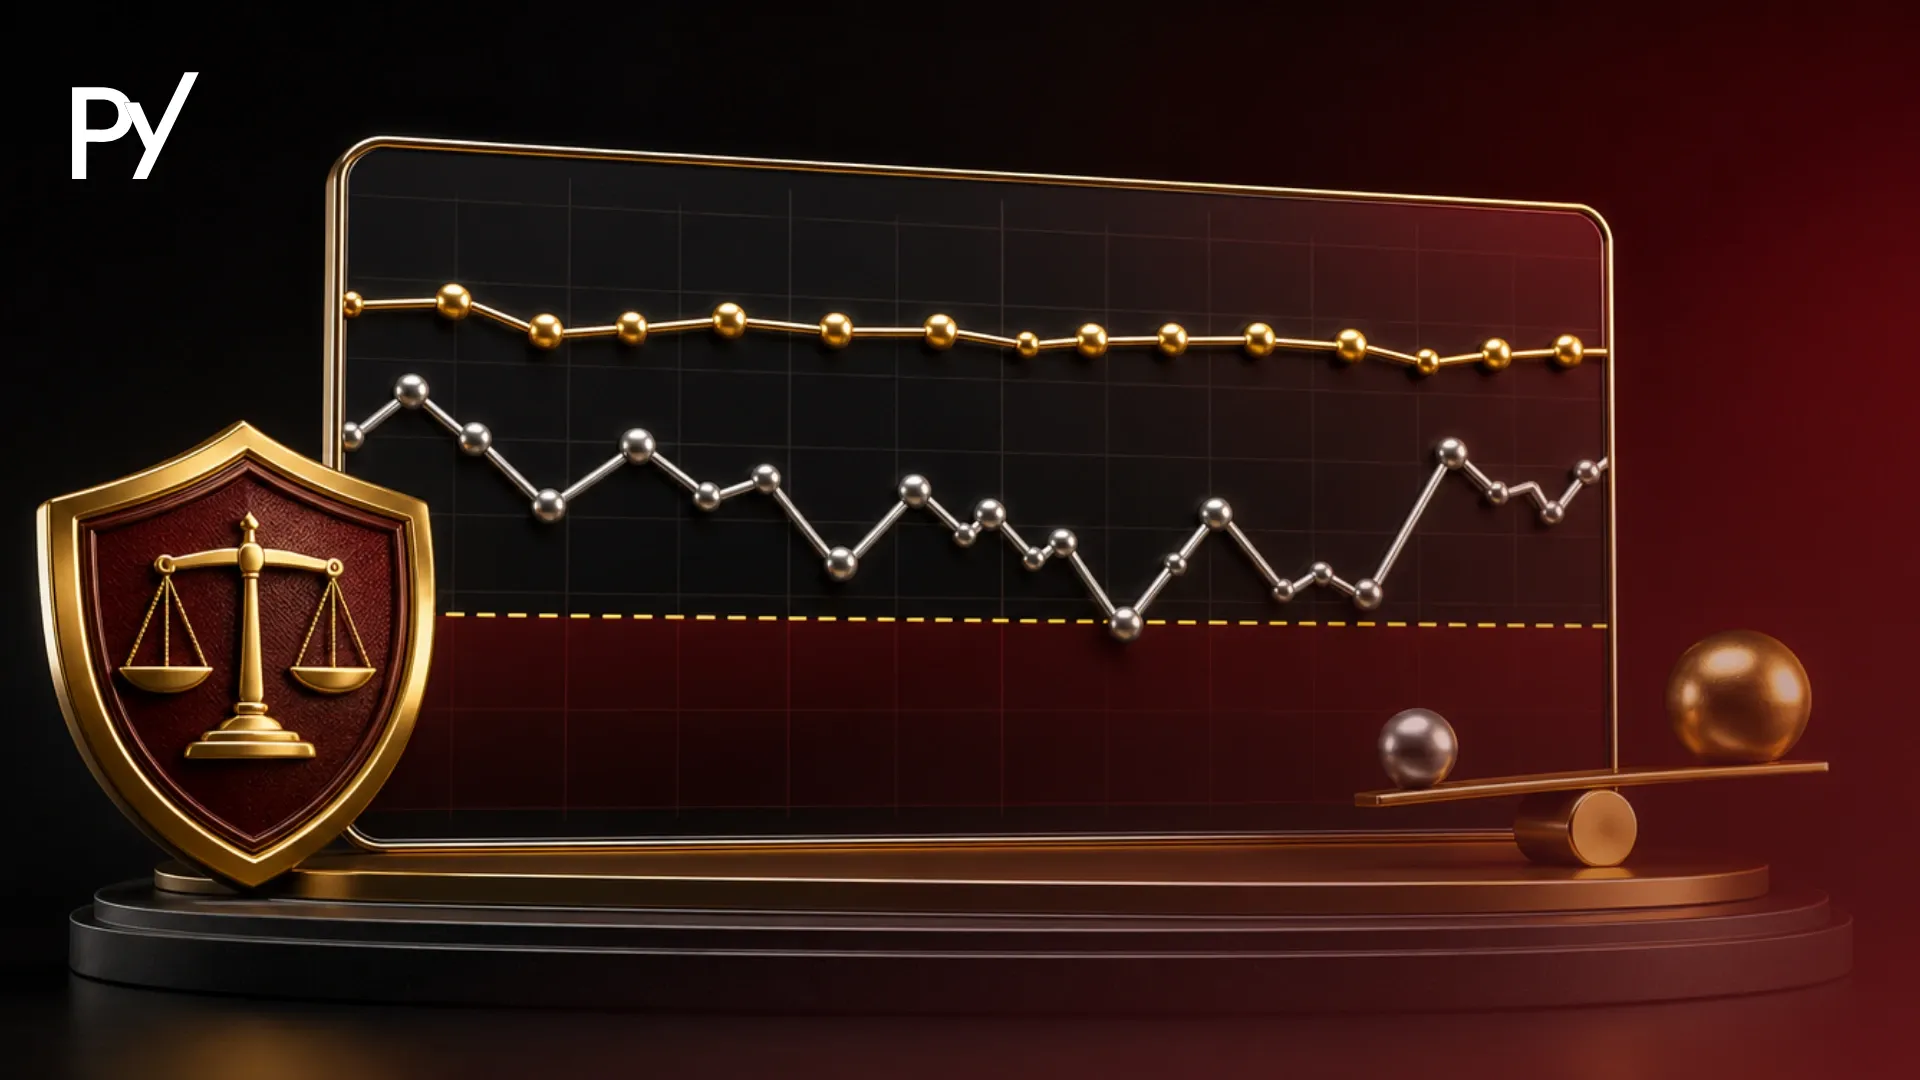
So what is a drawdown, and what does drawdown mean in practical terms? In retail trading, drawdown measures portfolio volatility and risk exposure. However, inside a prop firm account, drawdown is not merely a statistical metric—it operates as a strict, non-negotiable risk limit that determines whether you keep your funded account or breach your contract. Understanding how drawdown is calculated across open equity and closed balance is the single most critical factor in surviving a prop firm challenge.
How Drawdown Is Calculated (The Math Behind Peak-to-Trough)
To calculate drawdown, you must measure the distance between your peak equity and the lowest point reached before breaking that high.
Practical Example
If you start a trading account with $100,000 and make winning trades that bring your balance up to $110,000, your new peak is $110,000.
If you subsequently suffer a series of losing trades that pull your account balance down to $99,000:
- Dollar Drawdown: $110,000 - $99,000 = $11,000
- Percentage Drawdown: ($11,000 / $110,000) times 100 = 10%
Note that drawdown is calculated from the $110,000 peak, not your starting $100,000 deposit. Your drawdown from peak is 10%, even though your net loss from the initial deposit is only 1%.
Read our article on maximum drawdown to understand the drawdown calculation further.
Balance Drawdown vs. Equity Drawdown: The Floating Loss Trap
Understanding the distinction between balance-based and equity-based drawdown prevents unexpected account breaches in funded trading programs.
| Metric | Balance Drawdown | Equity Drawdown |
|---|---|---|
| Trigger Point | Calculated strictly from realized (closed) trades | Calculated continuously from open (floating) positions |
| Intraday Volatility | Ignores floating trade fluctuations | Tracks real-time peak-to-trough price swings |
| Risk Sensitivity | Lower intraday sensitivity | High sensitivity to high-volatility spikes |
Balance Drawdown only evaluates closed position balances. Floating drawdown during an open position will not breach a balance-based threshold until the position is officially closed.
Equity Drawdown incorporates real-time floating profit and loss. If an open trade moves heavily into drawdown before bouncing back to profit, the temporary low point counts against your equity drawdown limit. Many prop firm rules enforce strict equity-based limits, meaning an unmanaged floating position can breach an account before your stop-loss is even hit.
The Mathematical Asymmetry of Recovery
Drawdown creates a severe mathematical asymmetry: as percentage losses increase, the required gain to recover back to breakeven grows exponentially.

Because the dollar value of each percentage point decreases as your account shrinks, smaller amounts of capital remain to generate returns.
Continuing from the previous example of $100,000 initial capital, a 10% drawdown requires a manageable 11.1% gain to reach the previous peak. However, a 50% drawdown slashes your trading capital in half, requiring a 100% gain on remaining funds just to restore your original balance. Controlling drawdown magnitude early is essential for long-term capital preservation
Daily Drawdown vs. Maximum Drawdown in Funded Accounts
When trading evaluation accounts, risk rules generally separate loss limits into two core categories: daily drawdown and maximum drawdown.
1. Daily Drawdown
Daily drawdown caps the total amount you can lose within a single trading day (typically resetting at 5:00 PM Eastern Standard Time (EST) or midnight server time).
For example, on a $100,000 account with a 5% daily drawdown limit, your equity cannot drop more than $5,000 below the start-of-day balance/equity marker. If you cross this threshold, your account is automatically breached for violating daily risk parameters.
2. Maximum (Total) Drawdown
Maximum drawdown is the absolute floor your account can reach across its entire lifespan. If an account has a 10% maximum drawdown limit on a $100,000 allocation, your total equity can never drop below $90,000 at any point.
Many funded traders calculate their daily loss allowance correctly at the start of the week but forget that holding positions overnight recalibrates their daily baseline. When a trade opens on Wednesday and floats into negative territory on Thursday morning, that floating loss counts against Thursday's daily limit, not Wednesday's.
Trailing Drawdown Mechanics: The Hidden Challenge Trap
While static maximum drawdown limits stay fixed at a specific dollar amount (e.g., $90,000 on a $100,000 account), many evaluation rules implement a trailing drawdown.
How Trailing Drawdown Works
A trailing limit dynamically moves upward as your account balance or equity increases, maintaining a fixed distance behind your highest peak.
- Starting Point: You begin with a $100,000 account with a 6% trailing drawdown ($6,000 limit). Your minimum breach level starts at $94,000.
- Account Growth: You gain $4,000, bringing your peak balance to $104,000.
- The Trail: Your trailing threshold ratchets up by $4,000, moving from $94,000 to $98,000.
- The Lock Point: Most firms freeze the trailing limit at your starting balance ($100,000) once your account grows past a certain threshold.
The trap occurs when traders make open profit, fail to lock it in, and let the trade drop back down. If your account hits $104,000, your breach limit permanently locks at $98,000. If that trade reverses back to breakeven ($100,000 initial balance), you now have only $2,000 of drawdown room remaining instead of your original $6,000 buffer.
Understanding the difference between trailing and static drawdown models is critical when choosing an evaluation structure that matches your trading strategy.
Three Common Drawdown Errors That Cause Account Breaches
1. Over-leveraging During a Loss Streak
When a series of trades hit stop-losses, traders frequently increase lot sizes to recover losses quickly — a high-risk approach sometimes called martingale behavior, where position size is doubled or increased after a loss in an attempt to recover it faster. Due to the exponential nature of recovery math, higher leverage inside a drawdown accelerates account breach speeds.
2. Ignoring Holding Rules Across News and Daily Resets
Holding open positions through daily server resets can cause floating drawdowns to register against a newly calculated daily limit. Additionally, volatility spikes around high-impact economic news releases often widen spreads significantly, triggering equity drawdown floors via temporary slippage.
3. Misinterpreting
Assuming that all firms calculate drawdown from closed balance rather than open equity leads to premature breaches. Always review whether a firm uses end-of-day (EOD) trailing balance or real-time intraday floating equity trailing mechanics.
Drawdown as a Metric
Understanding what is drawdown in trading really comes down to one core idea: drawdown measures the distance between your peak capital and current equity trough. In retail trading, it serves as a performance metric; in funded prop trading, it acts as an absolute account safety rail. Managing drawdown requires strict position sizing, maintaining realistic risk-reward ratios, and knowing whether your account operates on static, trailing, daily balance, or floating equity loss limits.