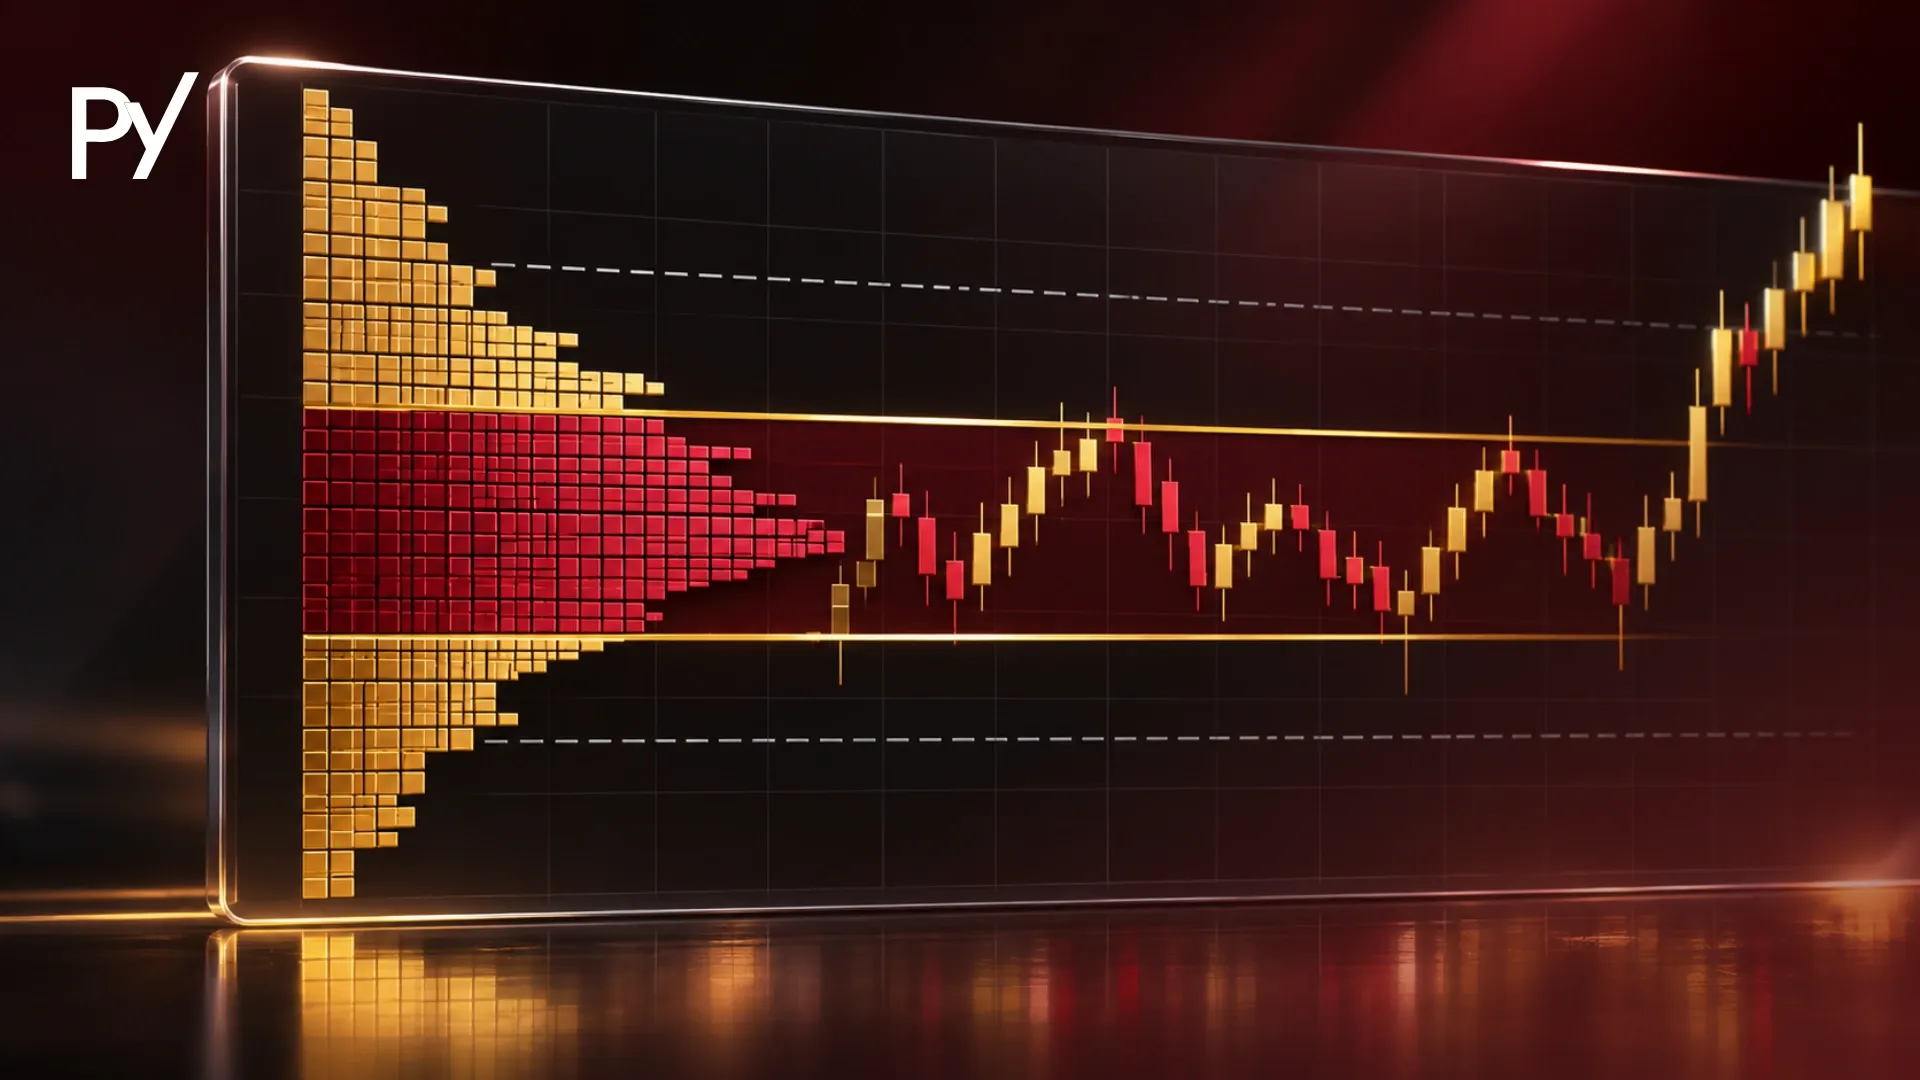
A WXY Elliott Wave is a complex corrective pattern, known as a Double Three, that links two three-wave corrective structures with a counter-trend X wave. It subdivides into a 3-3-3 sequence, extending price sideways to burn through momentum. In funded accounts, spotting this structure early helps traders avoid overtrading choppy ranges and breaching daily drawdown limits.
Because the X wave can itself unfold unpredictably, this Double Three structure is one of the hardest corrective patterns to trade without a clear invalidation plan.
You pass the initial impulse, but instead of continuing, the market traps you in a choppy, overlapping range that grinds down your daily drawdown limit. Complex corrections are designed to waste time rather than retrace price. This guide breaks down the structure’s anatomy, hard invalidation rules, and how to survive the chop inside a funded challenge.
What Is a WXY Elliott Wave Pattern?
A WXY Elliott Wave pattern is a complex correction that occurs when the market needs to consume more time rather than retracing deeper in price. In classic Elliott Wave theory, a standard simple correction unfolds as a three-wave A-B-C structure (such as a single zigzag or a flat). However, when a single A-B-C correction fails to sufficiently relieve the momentum of the primary trend, the market extends the consolidation sideways.
This extension forms the WXY structure, also known as a Double Three combination. The entire pattern moves contrary to the larger trend, but does so at a shallow, grinding pace.
The first complete A-B-C correction is labeled as Wave W. The market then produces a counter-trend reaction, labeled Wave X, before dropping into a second complete A-B-C correction, labeled Wave Y. Because these patterns drag on for extended periods, they are incredibly difficult to trade directionally and often wipe out impatient traders who expect an immediate reversal.
Feature
Simple ABC correction
WXY correction (Double Three)
Structure
One three-wave A-B-C structure
Two three-wave structures (W and Y) joined by Wave X
Internal count
5-3-5 in a zigzag
3-3-3 across W, X, and Y
Typical price behavior
Retraces price more directly
Consumes time sideways instead of retracing deeply
Anatomy and Rules: How the W, X, and Y Waves Subdivide
The W, X, and Y waves all subdivide into three-wave internal structures, creating a 3-3-3 sequence. This is the defining characteristic of a Double Three combination. Each major leg of the structure is itself corrective, meaning there are no five-wave impulse structures driving the primary direction of the pattern.
Wave W is the first corrective structure, which can take the shape of a zigzag or a flat. Wave X acts as the connector linking the two patterns; it can be any corrective structure, but it most commonly forms a standard zigzag. Wave Y is the final corrective leg, which can unfold as a zigzag, a flat, or occasionally a triangle. The combination of these structures (e.g., a Zigzag followed by a Flat, or a Flat followed by a Triangle) creates the overall WXY geometry.
There are strict structural rules and non-negotiables that dictate a valid WXY count:
Wave X Limit: In a standard double zigzag, Wave X can never exceed the origin of Wave W, and a break beyond the start of the entire corrective structure invalidates the count immediately. In an expanding double flat combination, Wave X can occasionally exceed that origin before Wave Y reverses, so treat this as a variant-specific exception rather than a universal rule.
Wave Y Progress: Wave Y must make progress beyond the extreme of Wave W in a double zigzag, though in sideways double flats, Wave Y may terminate near the same price level as Wave W.
Fibonacci Relationships: Traders use Fibonacci extensions to project the end of the structure. The most common relationship is Wave Y reaching exactly 100% (a 1:1 ratio) of the length of Wave W. In highly volatile markets, Wave Y may extend to the 161.8% Fibonacci projection of Wave W.
Why WXY Corrections Are Threaten Your Daily Drawdown in Prop Challenges
This WXY Elliott Wave pattern creates prolonged, overlapping ranges that trigger false breakouts and steadily bleed your daily drawdown. When you trade inside a funded evaluation, time is your enemy. You are bound by strict daily loss limits, and a complex correction is specifically designed by the market to consume time and frustrate participants.
The daily drawdown trap is the primary threat. Because a WXY pattern is full of overlapping sub-waves, it creates a visual illusion of trend resumption. Traders attempt to buy the bottom of an internal wave, only for the subsequent wave to sweep the lows before moving higher.
This pattern of repeated small losses quickly breaches trailing drawdown limits, which lock at your highest balance. Furthermore, during these extended sideways consolidations, liquidity often dries up, leading to widening spreads and slippage that degrade your edge and trigger tight stop-losses prematurely.
The psychological trap of anchoring bias also destroys accounts here. Traders fall in love with their bullish or bearish wave count and refuse to let it go, widening their risk to accommodate the chop instead of admitting they are stuck in a complex, unpredictable range.
Differentiating WXY Corrections from Classic Chart Patterns
Traders often mistake the internal legs of a WXY correction for standard reversal formations, leading to premature entries against the trend. Because complex corrections involve multiple swings back and forth across the same price zone, they frequently mimic the geometry of retail price action patterns.
For example, when a market drops into a complex double flat structure, retail traders might see a classic double-bottom and initiate w pattern trading setups. They anticipate an immediate, aggressive reversal based on the W-pattern geometry. However, in an Elliott Wave context, this structure is merely taking a pause.
The false double-bottom is just the completion of Wave W, meaning the subsequent upward reaction is a temporary Wave X that will eventually roll over into Wave Y, stopping out the early buyers. Understanding the higher timeframe WXY context prevents you from getting trapped in false structural price action signals.
Step-by-Step: How Funded Traders Should Navigate a WXY Structure
Successfully trading a WXY Elliott Wave pattern requires identifying the overlapping price action early and defining hard invalidation levels. If you are operating under tight funded-account constraints, capital preservation during these phases is significantly more important than catching the exact bottom.
Step 1: Identify Early Warning Signs of Complexity Look for overlapping candles, stalling momentum, and a failure to impulse out of the initial Wave W. If a market completes an A-B-C correction but fails to generate a strong five-wave impulse in the opposite direction, it is a primary warning that a WXY is unfolding.
Step 2: Establish the Primary and Alternate Wave Counts Never rely on a single wave count. Prepare both a primary scenario (e.g., the complex correction is ending) and an alternate scenario (e.g., the pattern is morphing into an even longer W-X-Y-X-Z structure) before you place any capital at risk.
Step 3: Define Hard Invalidation Levels Set your structural invalidation points immediately. If you are trading the completion of Wave Y, your hard stop must be placed at the structural level that completely invalidates the pattern. If Wave X retraces beyond the start of Wave W, the count is dead and you must exit immediately.
Step 4: Wait for Confirmation Out of Wave Y Do not attempt to pick the exact bottom or the exact top of Wave Y. Instead, wait for a structural breakout or a retest of the channel bounding the WXY correction. Keep your position sizing conservative to accommodate wider stops, ensuring a single trade cannot breach your firm’s typical 4% to 5% daily limit.
3 Common Mistakes Traders Make with WXY Patterns
The most common errors stem from impatience and a refusal to adapt when the complex structure breaks standard rules.
Trying to Front-Run Wave X Reversals: Traders frequently try to aggressively trade the counter-trend bounce of Wave X. Because Wave X is internal and highly unpredictable, attempting to capture it usually results in getting chopped to pieces.
Refusing to Accept Count Invalidation: When Wave X or Wave Y breaks a structural rule (such as exceeding 100% of Wave W in a double zigzag), traders often move their stops or widen their risk instead of accepting the loss. In a prop firm challenge, this behavior frequently ends in a drawdown failure.
Ignoring Higher Timeframe Context: Treating a 5-minute WXY pattern in isolation while fighting higher-timeframe order flow is a recipe for disaster. The complex correction must align with the broader market context to offer any predictive value.
Conclusion
Surviving a WXY Elliott Wave correction in a prop firm challenge comes down to capital preservation over prediction. Recognize the 3-3-3 structure as a warning sign of extended sideways action, and keep your risk strictly managed until Wave Y confirms its completion. By stepping back during the chop, you protect your trailing drawdown and position yourself safely for the true trend resumption. Before applying these advanced wave mechanics, ensure you have a firm grasp on foundational chart patterns to properly read the surrounding price action.
Disclaimer: This guide was written with AI assistance, reviewed for accuracy by the Proptary editorial team, and kept up to date. It's for education only — not financial advice. Prop trading and the financial markets carry a significant risk of loss, so consider your own situation and consult a licensed advisor before you trade.
FAQ
What is the difference between an ABC and a WXY correction?
An ABC correction is a simple three-wave corrective structure typically taking the form of a single zigzag or flat. A WXY correction is a complex combination (Double Three) that links two separate corrective structures together via an intermediate X wave. While an ABC correction often retraces price rapidly, a WXY correction grinds sideways to consume time, resulting in an internal 3-3-3 sub-wave sequence instead of 5-3-5.
Can Wave X retrace more than 100% of Wave W?
In a standard double zigzag, Wave X cannot retrace 100% or more of Wave W; exceeding the start of Wave W invalidates the count immediately. However, in an expanding double flat combination, Wave X can occasionally exceed the origin of Wave W before Wave Y reverses. For prop traders managing daily drawdown, treating a 100% retracement of Wave W as a hard invalidation point is the safest practice.
What is the difference between a Double Three (WXY) and a Triple Three (W-X-Y-X-Z)?
A Double Three (WXY) links two corrective structures with a single intervening X wave. A Triple Three (W-X-Y-X-Z) is an even rarer, highly extended sideways consolidation that links three corrective structures using two separate connector waves (X and XX). Triple threes develop when the market requires extreme time consumption before resuming the primary trend, creating extended chop zones that demand strict trade discipline.
Which technical indicators help confirm a WXY Elliott Wave pattern?
Momentum oscillators like the Relative Strength Index (RSI) and MACD are effective for confirming WXY structures. During Wave Y, look for momentum divergence where price reaches a marginal new high or low while the oscillator shows a weaker slope. Additionally, volume indicators typically show declining participation across the pattern, reflecting the market’s lack of aggressive directional momentum during sideways consolidation.
What timeframes should funded traders use to analyze WXY patterns?
Funded traders should identify WXY structures on higher timeframes like the 1-hour or 4-hour charts before executing trades on lower timeframes. Analyzing complex corrections on 1-minute or 5-minute charts is hazardous because intraday market noise frequently generates false corrective counts. Mapping the higher-timeframe boundaries allows you to identify macro invalidation levels and avoid overtrading the choppy internal sub-waves.
Disclaimer
Disclaimer: This guide was written with AI assistance, reviewed for accuracy by the Proptary editorial team, and kept up to date. It's for education only — not financial advice. Prop trading and the financial markets carry a significant risk of loss, so consider your own situation and consult a licensed advisor before you trade.
Proptary editorial team independently reviews prop trading firms, verifies payouts, and explains the rules that decide who keeps an account. We disclose affiliate relationships and publish methodology for every score.