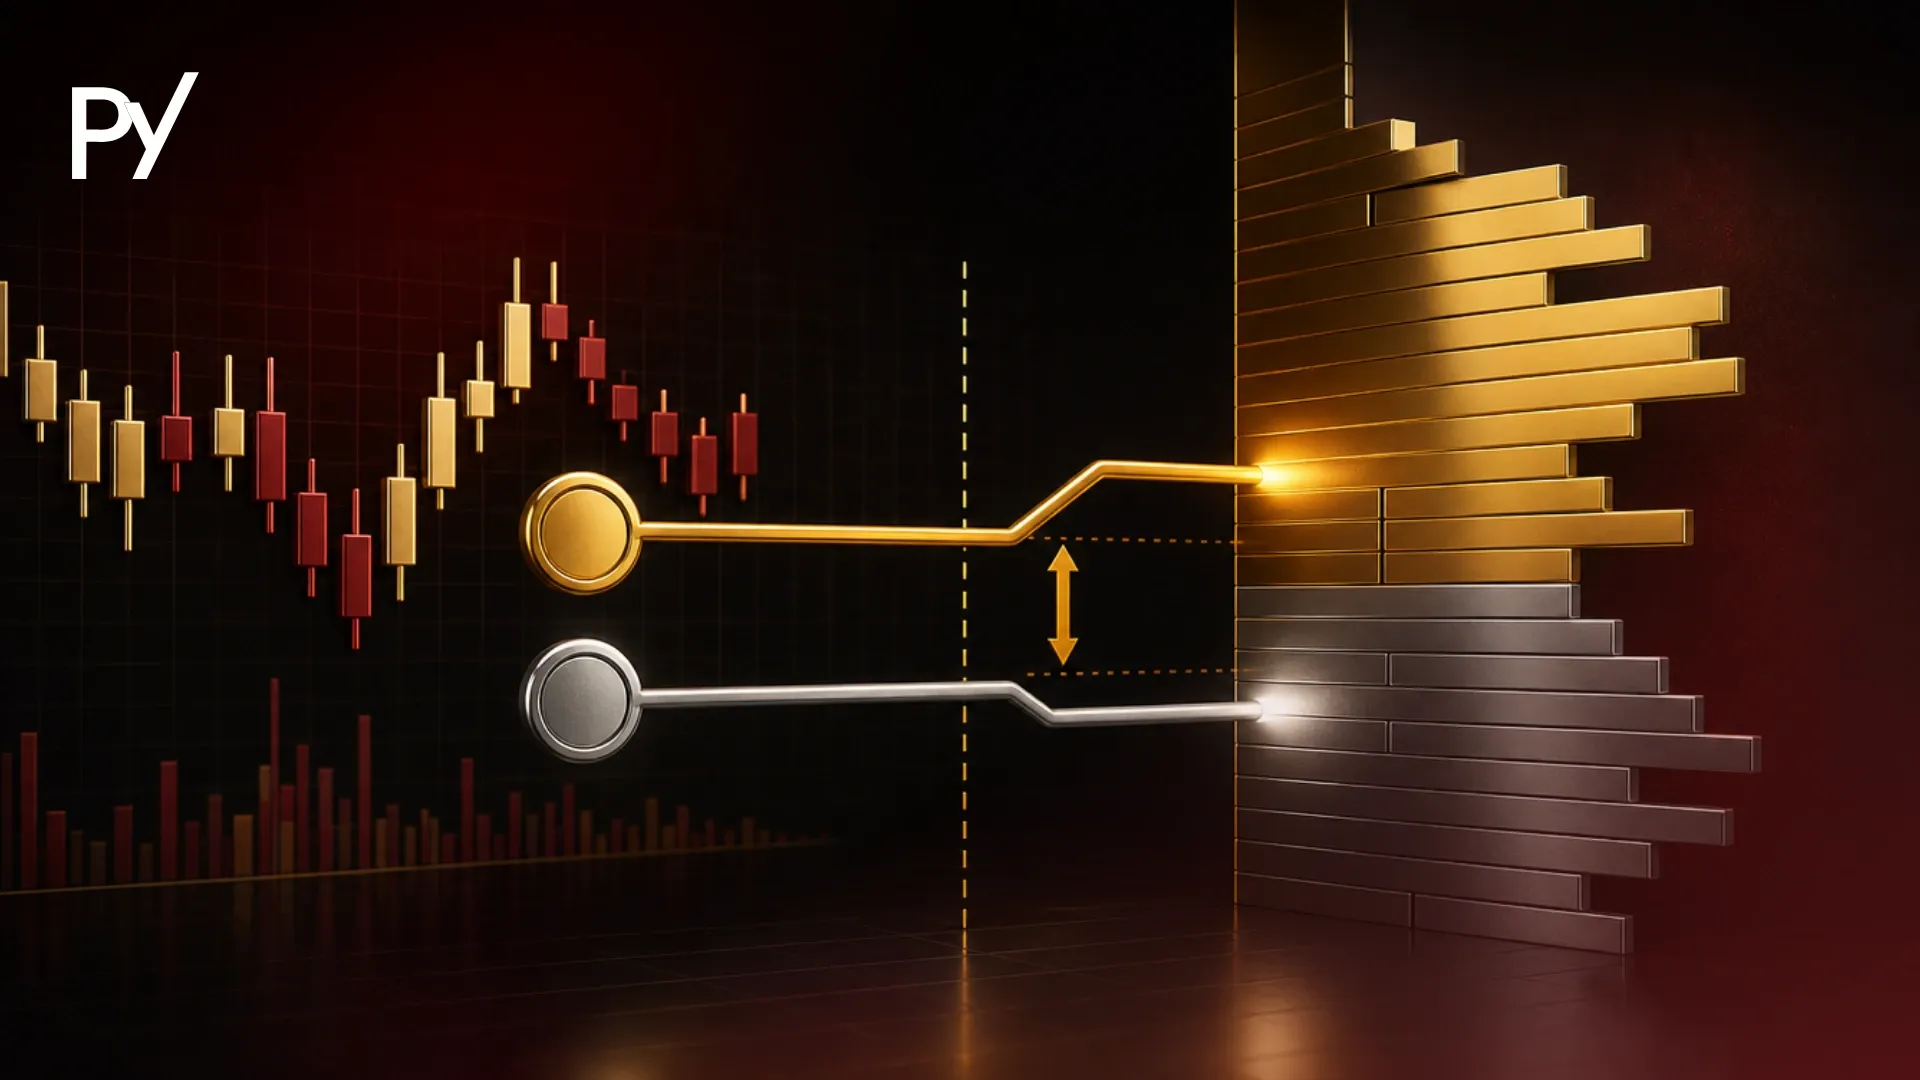
The Donchian Channel is an N-period technical indicator that plots the highest high, lowest low, and average price median over a chosen lookback period. Traders use its upper and lower bands to identify objective price breakouts and place dynamic trailing stop-loss levels. To protect funded accounts during market consolidation, entries require volatility filters to prevent costly false-breakout whipsaws.
The Donchian Channel is an N-period technical indicator that visualizes dynamic price volatility by plotting the highest high, lowest low, and median price boundary over a designated lookback window.
Trading breakouts without objective price boundaries often leads to chasing exhausted moves, triggering sudden market reversals, and violating daily drawdown thresholds on funded evaluation accounts. This guide explains how it is calculated, how to utilize its upper and lower bands for structured execution, and how to configure risk parameters to avoid account-invalidating false breakouts.
What Is the Donchian Channel? (Core Mechanics & Calculation)
The Donchian Channel measures market volatility and price extremes by plotting dynamic horizontal boundaries directly onto a price chart based on past market performance.
Developed by legendary futures trader Richard Donchian—frequently cited as the father of trend following—the indicator serves as a cornerstone for systematic entry and exit rules, most famously popularized by the Turtle Traders in the 1980s. Unlike static support and resistance lines that require subjective chart drawing, they automatically adjust as new high and low price points form across your chosen timeframe.
The indicator belongs to the broader family of volatility envelopes and channel-based tools, often combined with a moving average strategy to confirm range boundaries and structural market breakouts.
The mathematical construction of the Donchian Channel relies on three distinct calculation lines:
Upper Band: Represents the highest price achieved over the last N periods. Upper Band = max(H1, H2, …, HN)
Lower Band: Represents the lowest price achieved over the last N periods. Lower Band = min(L1, L2, …, LN)
Middle Band (Median Line): Calculates the arithmetic mean between the Upper and Lower bands. Middle Band = (Upper Band + Lower Band) / 2
Where N denotes the lookback period selected by the trader (with 20 periods serving as the default setting across most charting platforms), H represents periodic price highs, and L represents periodic price lows.
Because the calculation relies exclusively on absolute price highs and lows within the N-period lookback window, the channel outer bands remain completely horizontal until a new high or low is printed. When market price expands into new extremes, the outer boundary immediately steps higher or lower to reflect the updated price threshold.
How Donchian Channels Work in Funded Account Trading
They provide funded traders with an objective visual framework for identifying market structure shifts, trend continuation phases, and expanding volatility regimes.
When trading inside a prop evaluation account, emotional decision-making—such as shifting stop-loss orders or entering trades prematurely due to fear of missing out—frequently leads to rule breaches. The indicator eliminates subjective interpretation by establishing fixed, rule-based reference lines across three key execution dimensions:
1. Breakout Identification
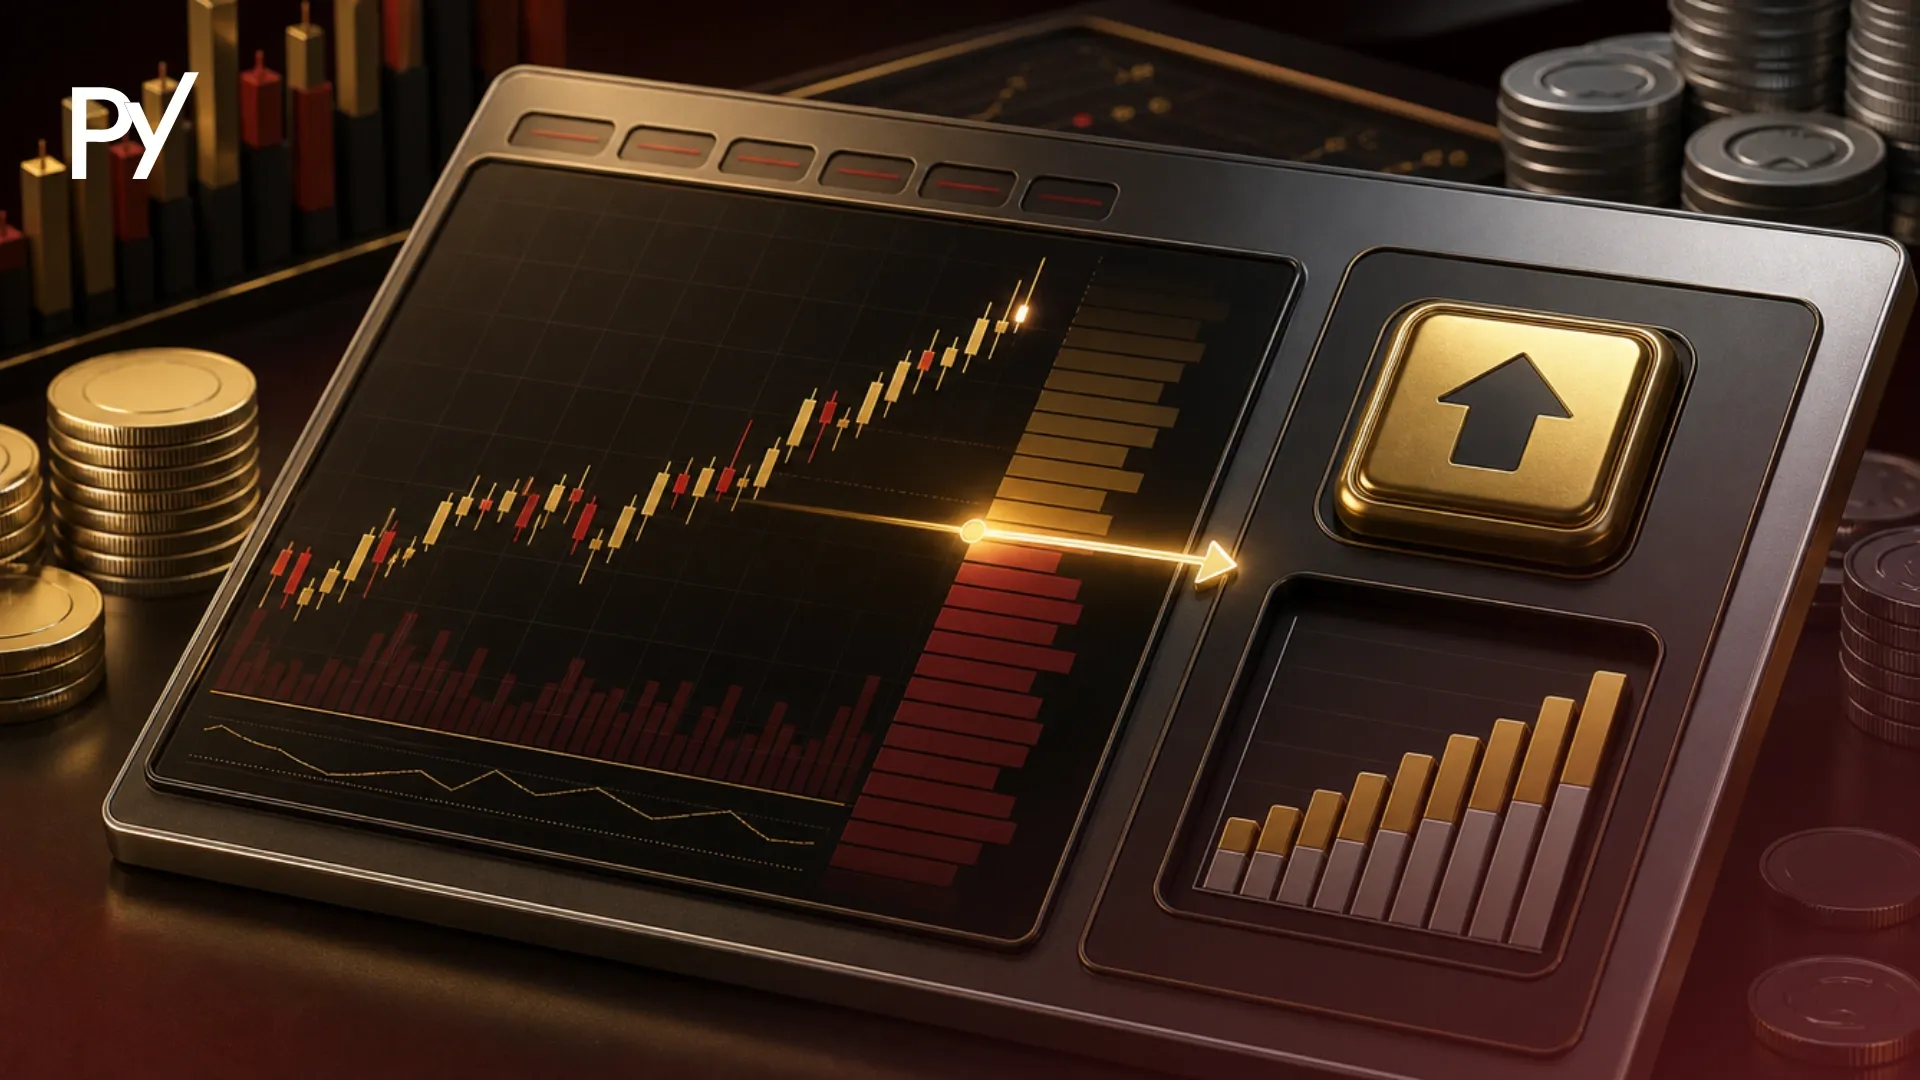
A bullish momentum breakout occurs when price touches or prints a new high above the Upper Band, signaling that the asset has cleared all swing highs within the designated N-period lookback window. Conversely, a bearish breakdown occurs when price penetrates the Lower Band, confirming market weakness below historical periodic lows.
Funded traders utilize these boundary breaches as mechanical entry triggers, ensuring trades are entered only when true structural expansion takes place.
2. Dynamic Trend Baseline
The Middle Band (Median Line) acts as a dynamic baseline separating bullish market control from bearish market control. When price trades consistently above the Middle Band, the prevailing market bias remains bullish. When price trades below the Middle Band, the short-term bias favors sellers.
Traders frequently use the Middle Band to filter trade direction—only taking long breakout trades when price stays elevated above the median line.
3. Volatility Expansion Sensing
The vertical distance between the Upper Band and Lower Band dynamically expands and contracts in response to price range variation:
Channel Band Expansion: Widening bands indicate expanding market volatility and strong directional trend momentum.
Channel Band Contraction (Squeeze): Narrowing bands signal prolonged market consolidation, lower volatility, and an impending energetic breakout.
Donchian Channel vs. Keltner Channel vs. Bollinger Bands
While this indicator, Bollinger Bands, and Keltner Channels all belong to the envelope indicator family, their mathematical formulas react to market price movement in distinctly different ways.
Understanding these technical differences prevents funded traders from misinterpreting signal sensitivity across varying volatility regimes.
Feature / Attribute
Donchian Channel
Keltner Channel
Bollinger Bands
Primary Driver
Absolute N-period Highest High & Lowest Low
Exponential Moving Average (EMA) + Average True Range (ATR)
Simple Moving Average (SMA) + Standard Deviations
Band Outer Boundary
Pure price extremes (H(N) / L(N))
Volatility range offset based on ATR
Statistical distribution offset based on standard deviation
Reaction to Price Spikes
Steps up/down immediately and stays flat until new extreme forms
Smooths price spikes via exponential moving average
Expands rapidly in non-linear curves to absorb standard deviations
Primary Use Case
Pure trend breakouts and mechanical channel trailing stops
Trend-following pullbacks and channel mean-reversion
Mean-reversion trading and statistical volatility squeezes
Prop Account Benefit
Objective price levels with zero volatility smoothing lag
Smoother boundaries that reduce noise during choppy sessions
Visualizing extreme market overextension relative to statistical norm
This indicator is unique because it does not utilize moving average smoothing or standard deviations for its outer bands. It reflects absolute price extremes. If EUR/USD touches a 20-day high, the upper Donchian Channel line locks directly onto that price level. This absolute clarity makes Donchian Channels ideal for breakout systems, whereas Bollinger Bands and Keltner Channels excel at evaluating mean-reversion entries within established ranges.
Adapting the channel settings to match specific evaluation challenge rules, asset volatility, and trade execution timeframes is critical for maintaining consistent account risk metrics.
Channel Boundary
Trading Function
Execution Strategy
Upper Band
Breakout Entry Trigger
Enter long orders when candle closes above the N-period highest high
Middle Band
Dynamic Trailing Baseline
Trail initial stop loss behind the median line as trend progresses
Lower Band
Structural Exit / Stop Loss
Serve as conservative risk floor or systemic trend reversal boundary
Parameter Selection for Funded Accounts
The standard default setting for the Donchian Channel is 20 periods, inherited from classic daily trend-following systems. However, intraday prop traders often adjust lookback parameters based on specific market objectives:
Short-Lookback (10 to 15 Periods): Generates high-frequency breakout signals suited for rapid momentum scalp setups. Risk Warning: Produces higher false-breakout frequency during sideways market consolidation.
Standard-Lookback (20 Periods): Balances responsiveness and signal reliability across liquid Forex pairs, Gold, and Equity Indices.
Conservative Trend Filter (55 Periods): Ideal for identifying major market structure shifts on higher timeframes (4-hour and Daily). A 55-period channel helps align lower-timeframe scalp entries with broader macro trends.
Mechanical Trailing Stop Placement
Managing trailing drawdown rules on funded trading accounts requires objective stop placement that locks in open profits without cutting winning trades prematurely:
Middle Band Trailing: Place your stop loss behind the dynamic Middle Band. As price moves favorably, the median line steps higher, trailing your risk mechanically toward break-even.
Opposite Band Trailing (Classic Donchian Exit): Trail your stop loss along the Lower Band for long positions, or the Upper Band for short positions. This allows trade setups ample room to breathe during healthy market pullbacks, exiting only when the entire N-period price structure collapses.
Timeframe Combination: Use a higher-timeframe Donchian Channel (e.g., 1-hour 20-period) to determine overall trend direction, while executing entries and trailing stops on a lower timeframe (e.g., 5-minute 20-period).
Common Traps: Why Donchian Breakouts Blow Funded Accounts
While the indicator provides clear breakout signals, applying them mechanically without structural risk management can rapidly lead to daily drawdown breaches on funded accounts.
Trap 1: The Consolidation Whipsaw
This indicator performs poorly during low-volatility sideways markets. In ranging conditions, price regularly spikes above the 20-period high or drops below the 20-period low to sweep resting liquidity, only to immediately reverse back into the middle of the channel.
Traders who buy every Upper Band touch and sell every Lower Band touch during market consolidation experience rapid consecutive losses—a sequence known as a "whipsaw." Accumulating three or four consecutive whipsaw losses in a single session can instantly breach maximum daily drawdown limits.
Mitigation: Combine the channel with an Average Directional Index (ADX) filter or volume indicator. Refrain from taking breakout entries when ADX reads below 20, indicating a non-trending, ranging environment.
Trap 2: Fixed Lot Sizing on Expanding Bands
When market volatility suddenly expands, the distance between the Upper Band and Lower Band widens dramatically. Taking a trade with a fixed lot size while using the opposite channel boundary as a stop loss can inadvertently double or triple your normal capital exposure.
Mitigation: Calculate position size based on current dollar risk rather than fixed lot sizes. Measure the exact point distance between your entry trigger and channel stop loss, adjusting lot sizes dynamically so total risk never exceeds 0.5% to 1.0% of total account balance.
Trap 3: Slippage and Liquidity Gaps During News Events
During high-impact news releases (such as US Non-Farm Payrolls or CPI announcements), price often gaps dozens of pips past the Donchian Channel Upper or Lower Band in a single millisecond.
Placing buy-stop or sell-stop orders directly on channel extremes prior to high-impact economic releases exposes funded accounts to severe execution slippage. Fill prices may execute far beyond intended entry levels, severely distorting risk-to-reward ratios and risking immediate daily loss violations.
Mitigation: Avoid trading Donchian Channel breakout orders within 5 to 10 minutes before and after Tier-1 economic news releases.
Conclusion
The Donchian Channel offers funded traders an objective, systematic method for mapping price extremes, identifying structural trend breakouts, and automating dynamic risk management. By removing subjective guesswork from support and resistance levels, the indicator enforces trading discipline—a crucial attribute for surviving strict evaluation challenges. However, because it reacts purely to price extremes, entering breakouts during ranging markets can lead to severe consolidation whipsaws. To protect account equity and preserve drawdown limits, always pair channel entries with volatility filters, strict position-sizing calculations, and higher-timeframe trend analysis.
Once you have mastered visual volatility boundaries, learn how a moving average strategy can refine your execution system.
Disclaimer: This guide was written with AI assistance, reviewed for accuracy by the Proptary editorial team, and kept up to date. It's for education only — not financial advice. Prop trading and the financial markets carry a significant risk of loss, so consider your own situation and consult a licensed advisor before you trade.
FAQ
What is the standard lookback period for the Donchian Channel?
The default setting for the Donchian Channel is 20 periods, originally derived from Richard Donchian's classic trend-following framework. On daily charts, a 20-period lookback represents approximately one month of trading activity. Traders often adjust this parameter—using 10 to 15 periods for faster momentum scalping or 55 periods for higher-timeframe trend filtering.
What is the main difference between Donchian Channels and Bollinger Bands?
Donchian Channels measure absolute price extremes by plotting the highest high and lowest low over an N-period window without smoothing. In contrast, Bollinger Bands use a moving average baseline offset by standard deviations, causing their boundaries to react continuously to statistical price volatility rather than strict price high/low thresholds.
How do traders use the Donchian Channel for stop-loss placement?
Traders place mechanical trailing stops along the opposing channel boundary or the Middle Band (median line). For a long position, trailing a stop loss behind the Lower Band or Middle Band ensures the trade stays active as long as the market maintains structural higher lows, exiting automatically if price collapses.
Why do Donchian Channel breakouts generate false signals during market consolidation?
Donchian Channels plot past price extremes regardless of market context. During sideways consolidation, price frequently spikes above or below past 20-period boundaries to sweep liquidity before instantly reversing. Without a volume or ADX volatility filter, taking every channel touch in range-bound markets causes repeated whipsaw losses that erode account equity.
Is the Donchian Channel reliable for day trading funded evaluation accounts?
Yes, provided it is paired with strict risk management and trend filtering. Intraday traders can use a higher-timeframe Donchian Channel to establish macro bias while executing lower-timeframe breakouts. However, lot sizing must adapt dynamically to channel width to prevent violating daily drawdown constraints during periods of high volatility.
Disclaimer
Disclaimer: This guide was written with AI assistance, reviewed for accuracy by the Proptary editorial team, and kept up to date. It's for education only — not financial advice. Prop trading and the financial markets carry a significant risk of loss, so consider your own situation and consult a licensed advisor before you trade.
Proptary editorial team independently reviews prop trading firms, verifies payouts, and explains the rules that decide who keeps an account. We disclose affiliate relationships and publish methodology for every score.