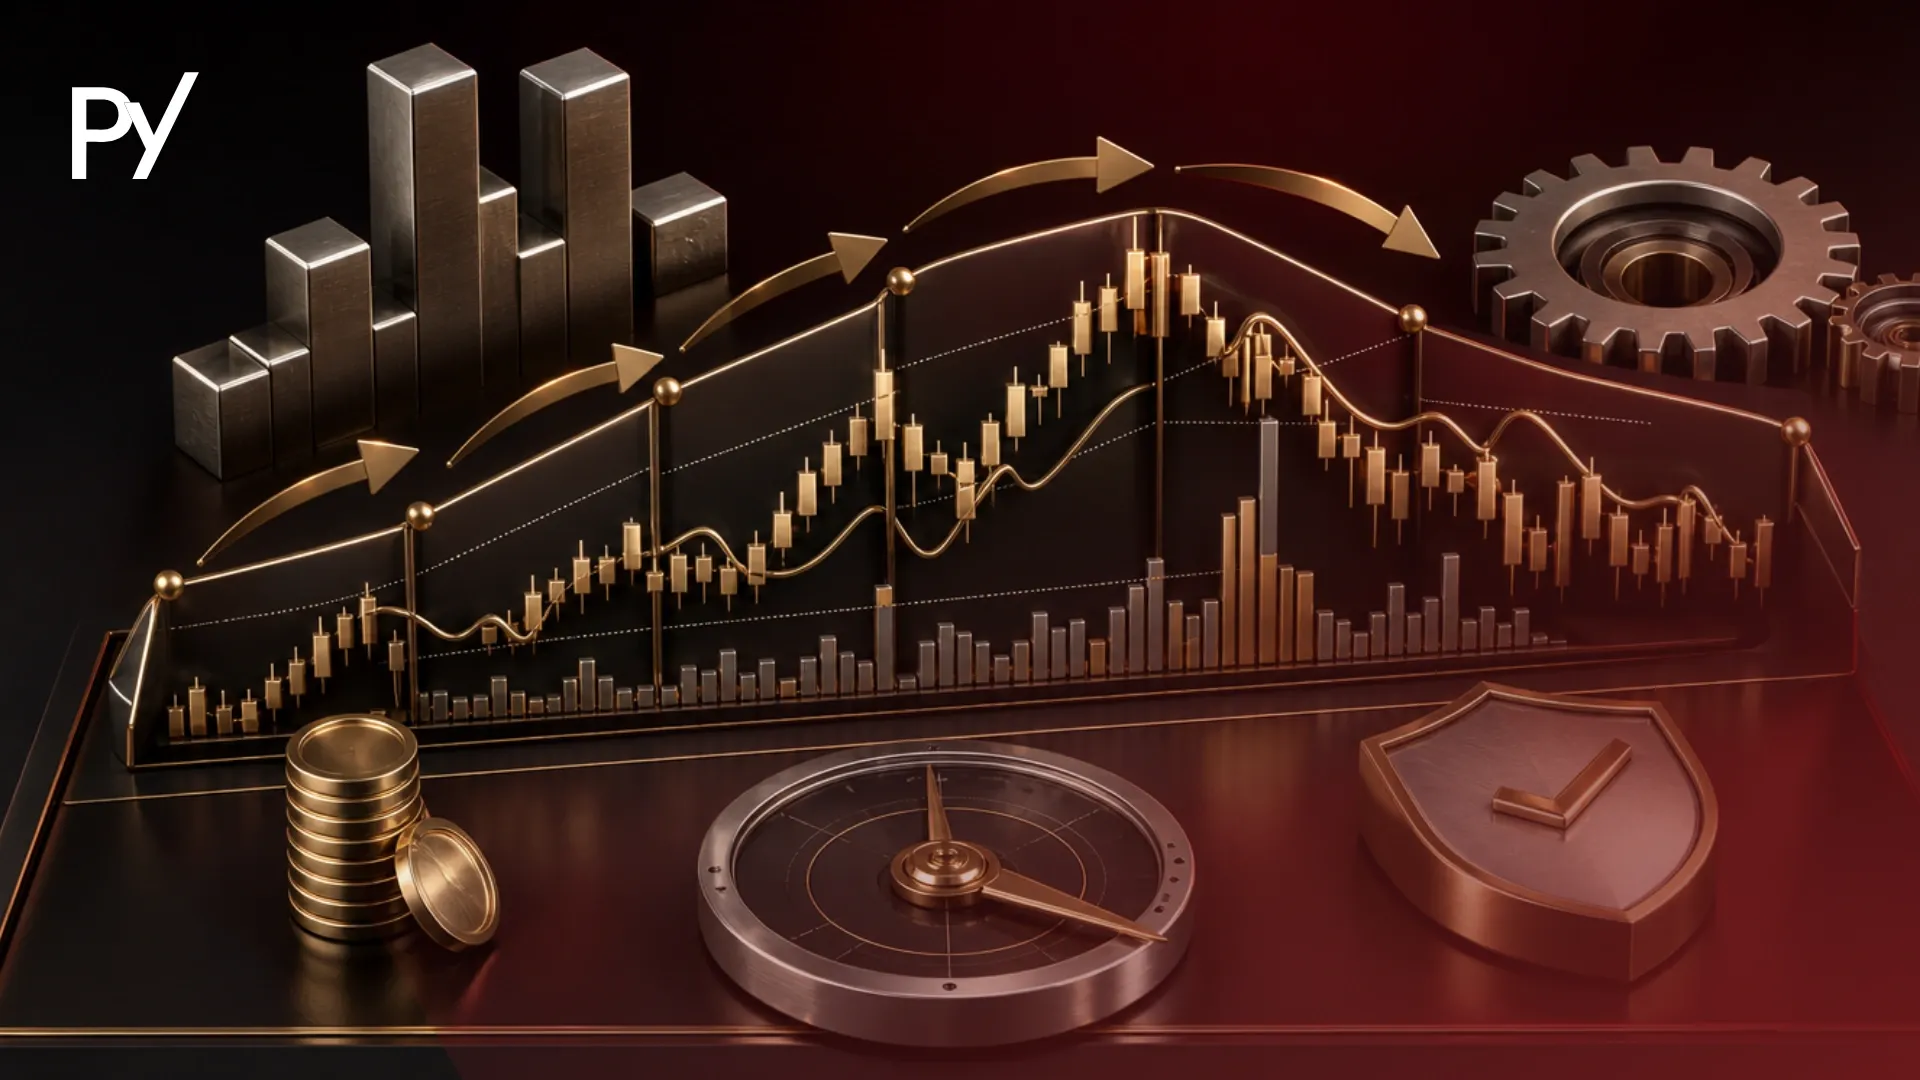
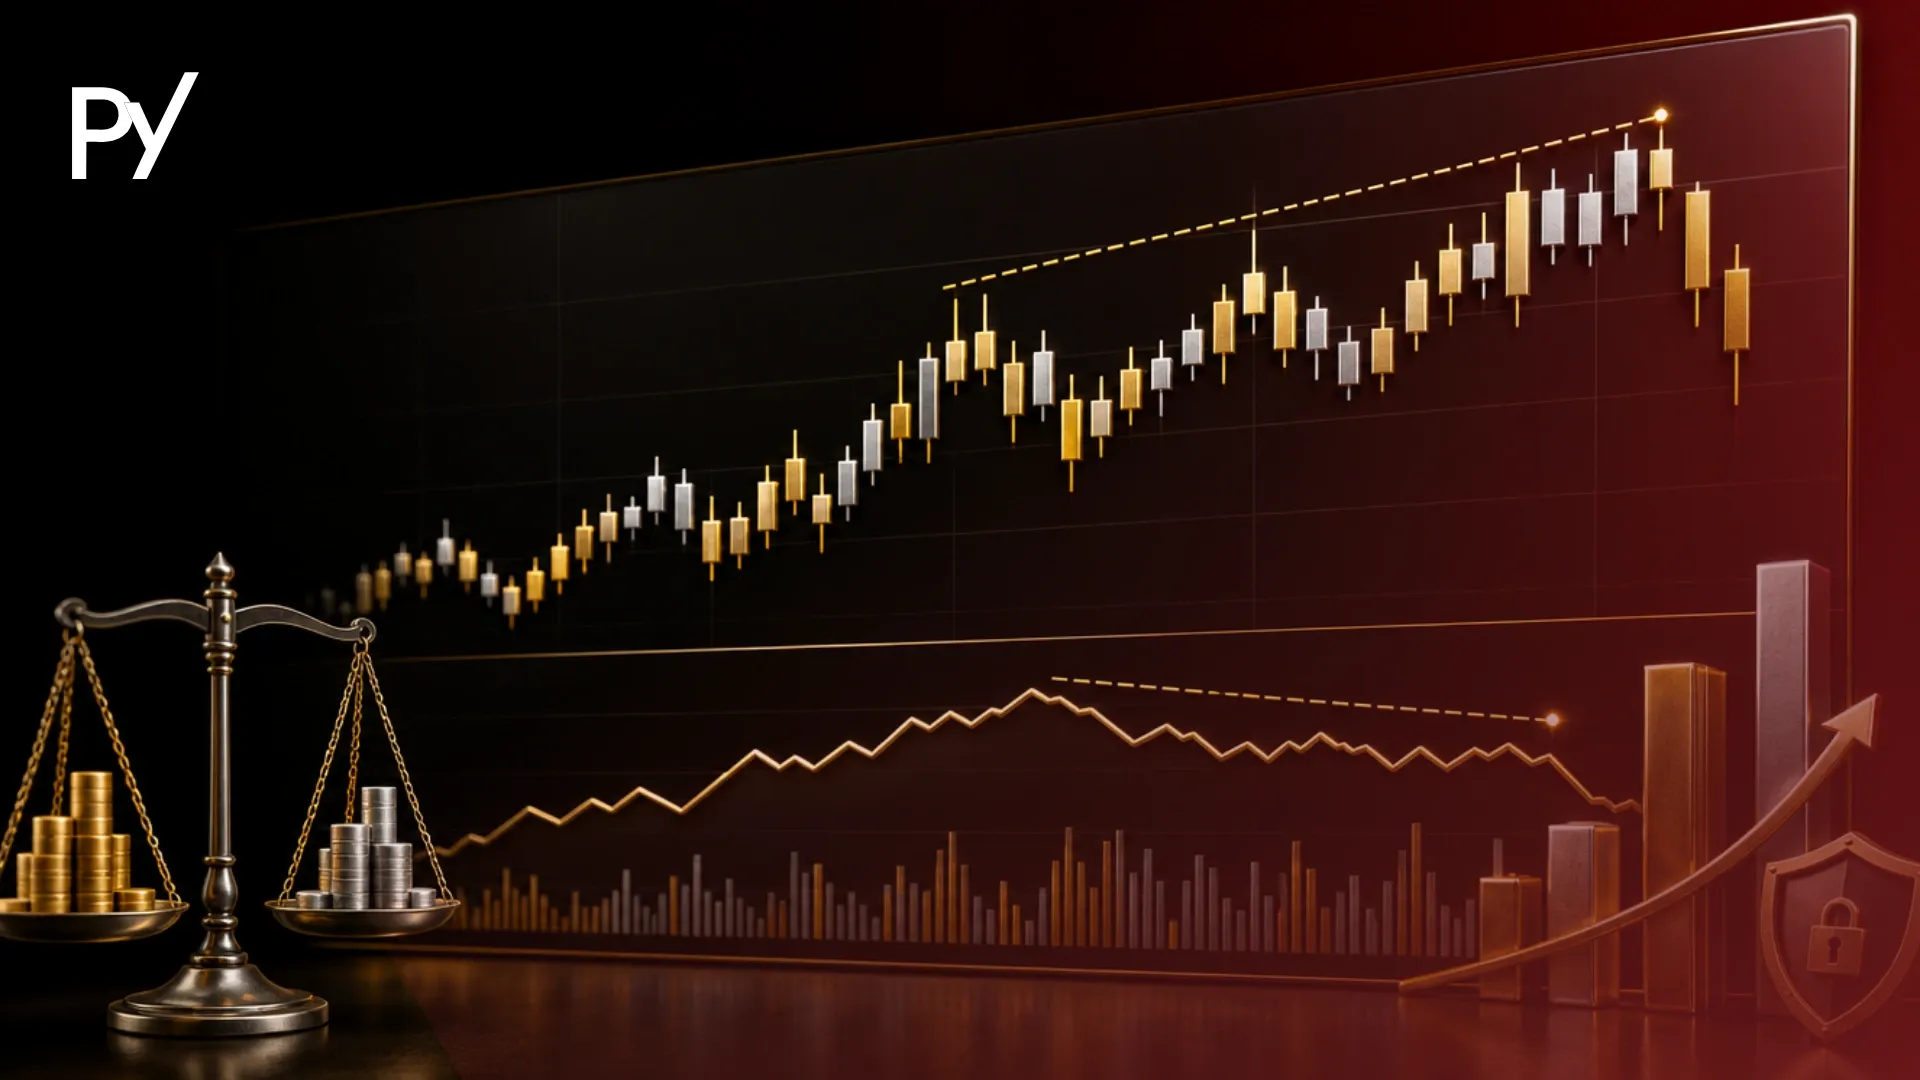
Candlestick charts display historical price action over a chosen timeframe using four data points: Open, High, Low, and Close (OHLC). The real body shows directional conviction between open and close prices, while upper and lower wicks mark price rejection and extreme volatility. Reading candlesticks effectively requires analyzing candle anatomy alongside higher-timeframe market structure rather than trading isolated shapes.
A candlestick chart is a financial visual tool that displays price movement over a set timeframe by recording four core data points: the Open, High, Low, and Close (OHLC) prices.
Many traders buy a prop firm evaluation and jump straight to trading visual patterns without understanding the order flow creating those shapes. Failing to read candle mechanics often leads to entering trades during intrabar volatility, triggering lower-wick rejections that breach tight trailing drawdown limits.
This guide covers how candlestick anatomy works, how to read wicks and bodies in market context, and how to execute trades safely on funded accounts.
What Is a Candlestick Chart? (OHLC Mechanics)
Candlestick charts represent price movement over a defined period by organizing market transactions into four distinct price points: Open, High, Low, and Close (OHLC). Originating in 18th-century Japan to track rice market sentiment, modern candlestick charts give you a complete visual snapshot of market conviction and volatility over any selected timeframe.
Unlike standard line charts that only display closing prices, every individual candle on a chart tells the complete story of buyer and seller interaction within a fixed block of time. Whether you analyze a 1-minute chart or a daily chart, the candlestick is built using four key components:
Open: The exact price at which trading began for the selected timeframe.
High: The absolute highest price level traded during the timeframe.
Low: The absolute lowest price level traded during the timeframe.
Close: The final price recorded when the timeframe period ended.
The relationship between the Open and Close determines the color and sentiment of the candle body. When the Close is higher than the Open, the candle displays a bullish color (typically green or white), signaling that buyers won the period. Conversely, when the Close falls below the Open, the candle displays a bearish color (typically red or black), showing that sellers held control.
Every timeframe aggregates transactions differently. A single 4-hour candlestick contains the exact price movement of four individual 1-hour candles or twenty-four 10-minute candles. Understanding how lower timeframe prices aggregate into higher timeframe candles is fundamental to reading overall market structure.
Anatomy of a Candlestick: Real Body vs. Wicks (Shadows)
A candlestick consists of a thick central rectangular block called the real body and thin vertical lines extending from the top and bottom called wicks or shadows. Learning to read the proportion between the real body and the wicks reveals who is winning the ongoing tug-of-war between buyers and sellers.
The Real Body: Measuring Directional Momentum
The real body covers the space between the opening price and the closing price. The size of the real body reflects market conviction and directional momentum:
Long Real Bodies: A tall candle body indicates strong buying or selling pressure. A large green body shows that buyers aggressively pushed price upward from the open to close without significant pushback. A large red body shows aggressive short selling.
Short Real Bodies: A small candle body indicates low volatility or consolidation. Neither buyers nor sellers were able to move the price significantly from the open by the time the candle closed.
Upper and Lower Wicks: Reading Price Rejection
The wicks — also called shadows — represent the extreme high and low prices reached during the candle's lifespan before price pulled back. Wicks reveal where market liquidity was tapped and rejected:
Upper Wick (Upper Shadow): Represents the highest point reached during the session. A long upper wick indicates that buyers attempted to push prices higher, but sellers stepped in aggressively and drove the price back down before the close. This signals selling overhead resistance or aggressive profit-taking.
Lower Wick (Lower Shadow): Represents the lowest point reached during the session. A long lower wick shows that sellers pushed prices down, but buyers stepped in at lower demand levels to lift prices before the candle closed. This indicates price rejection at support.
When you combine body size and wick length, you can decode broader multi-candle reversal structures, such as a piercing line candlestick pattern, which relies on identifying strong lower wick rejections followed by deep bullish real body penetration into previous selling territory.
How to Read Candlesticks Step-by-Step: A 4-Stage Framework
Reading candlesticks effectively requires analyzing market structure on high timeframes before interpreting individual candle bodies, wicks, and confirmation closes. A standalone candle shape means very little in isolation; its true meaning depends entirely on where it appears relative to major support, resistance, and prevailing market trends.
Step 1: Establish Higher Timeframe Market Context
Before looking at individual candles on an execution chart (e.g., 5-minute or 15-minute), mark your key support and resistance zones on higher timeframes (e.g., 1-hour or 4-hour). A bullish hammer candle printed in the middle of a range holds little statistical value, whereas that exact same hammer printed directly at a major 4-hour support level carries significant weight.
Step 2: Evaluate Real Body Expansion and Contraction
Examine how candle body sizes change as price approaches key structural levels. Large expanding bodies indicate strong trend momentum. As price approaches a support or resistance zone, shrinking real bodies signal momentum exhaustion, warning you that the prevailing move is losing strength.
Step 3: Analyze Wick Length and Liquidity Rejections
Look for long wicks probing key support or resistance lines. A sharp lower wick poking below key support that quickly snaps back into the range indicates a liquidity sweep — where large institutional participants fill buy orders against retail stop-losses. When trading funded accounts, identifying these rejections helps you avoid getting caught on the wrong side of fake breakouts.
Step 4: Apply the 3-Candle Confirmation Rule
Never execute a trade based on a single isolated candlestick shape. Use the 3-candle confirmation rule to reduce execution risk:
Candle 1 (Context Candle): Establishes the arrival at a key zone or shows a trend deceleration.
Candle 2 (Signal Candle): Displays rejection via a long wick, Doji (a candle where open and close are nearly identical, signaling indecision), or reversal body.
Candle 3 (Confirmation Candle): Closes convincingly in the direction of the expected move, confirming that order flow has shifted in your favor.
When trading funded challenges, avoid entering market orders during the final 30 seconds of an intraday candle close. Algorithmic liquidity sweeps frequently create sudden upper or lower wicks in the closing seconds, filling orders at unfavorable slippage levels and pushing floating losses directly toward daily drawdown boundaries.
Timeframe Noise, Spread Expansion, and Execution Realities
Lower timeframe candlesticks are heavily distorted by market noise, order routing delay, and spread expansion, making single candle shapes unreliable entry triggers when trading under tight drawdown rules.
While daily and 4-hour candlesticks represent significant institutional order volume, 1-minute and 5-minute candles are frequently shaped by brief retail order flow and broker spread variations. A long lower wick on a 1-minute chart may simply represent a temporary liquidity gap rather than genuine institutional buying support.
Higher Timeframe (4H/1D): High reliability — reflects institutional volume.
Lower Timeframe (1M/5M): High market noise — driven by micro-spikes and spreads.
Furthermore, prop firm traders must account for execution conditions around candle opens and closes. During major session transitions (such as the New York equity open or the Asian session roll), bid-ask spreads routinely expand across funding platforms.
If you enter a trade the moment a candle closes during spread expansion, your entry price may sit several pips away from the visible candle close on your chart, instantly placing your trade in a floating drawdown.
3 Candlestick Traps That Trip Funded Traders
Funded traders frequently lose accounts to candlestick traps by treating visual candle shapes as standalone entry signals without verifying market structure or account drawdown constraints.
Trap 1: Isolation Bias (Ignoring Market Structure) The most common error is buying or selling a recognizable candlestick pattern regardless of where it appears on the chart. A bullish engulfing candle printed right under heavy resistance is not a buy signal; it is a sign that price is running directly into supply. Always prioritize market structure over single-candle visuals.
Trap 2: Chasing Intra-Candle Momentum Entering a trade while a candle is still forming is a fast way to blow a funded account. An active 15-minute candle may look like a massive, solid green Marubozu (a candle with little to no wick, signaling one-sided control) with two minutes remaining. However, a sudden burst of selling before the close can completely collapse the real body, leaving behind a long upper wick rejection. Always wait for the official candle close before evaluating the print.
Trap 3: Misjudging Wick Volatility Against Trailing Drawdowns Prop firms often enforce daily or trailing drawdown limits calculated on equity spikes rather than closed account balance. Entering a trade right as a volatile rejection wick forms can cause temporary floating losses that breach your maximum trailing drawdown threshold — even if the candle eventually closes in profit. Always position size for the absolute tip of the wick, not just the candle body close.
Decoding Market Sentiment
Reading candlesticks correctly is about decoding market sentiment, order flow, and price rejection rather than memorizing isolated visual shapes. By evaluating OHLC mechanics, analyzing the ratio of real bodies to wicks, and applying higher-timeframe context, you turn candlestick analysis into a reliable risk management tool.
When trading funded accounts, waiting for full candle confirmation and accounting for spread expansion protects your equity against sudden intraday drawdowns.
FAQ
How do you read a candlestick chart step-by-step?
Start by identifying the higher-timeframe trend to establish market structure. Next, evaluate the candle body size to measure buying or selling momentum. Then, inspect upper and lower wicks to identify price rejection at key support or resistance levels. Finally, wait for a confirmation candle close before entering a trade to avoid fakeouts.
What do long wicks on a candlestick mean?
Long wicks (or shadows) indicate price rejection and market volatility within that timeframe. A long upper wick shows buyers pushed price higher but were driven back down by sellers. A long lower wick shows sellers pushed price down before buyers stepped in. Long wicks often point to liquidity sweeps near key structural levels.
What is the difference between green and red candlesticks?
Green (or white) candlesticks are bullish prints, meaning the closing price was higher than the opening price for that timeframe. Red (or black) candlesticks are bearish prints, meaning the closing price was lower than the opening price. The color instantly signals whether buyers or sellers held control during the period.
What is the 3-candle confirmation rule?
The 3-candle confirmation rule requires three specific candles before execution: a context candle establishing arrival at key structure, a signal candle displaying a rejection wick or reversal body, and a confirmation candle closing strongly in your intended direction. This rule filters out lower-timeframe noise and reduces premature trade entries.
Are candlestick patterns reliable on lower timeframes like 1-minute or 5-minute charts?
Lower timeframe candlesticks carry high market noise, minor retail order spikes, and broker spread fluctuations. While single candle shapes on 1-minute or 5-minute charts frequently trigger false signals, they become more reliable when aligned with higher-timeframe (1-hour or 4-hour) support and resistance levels.
Disclaimer
Disclaimer: This guide was written with AI assistance, reviewed for accuracy by the Proptary editorial team, and kept up to date. It's for education only — not financial advice. Prop trading and the financial markets carry a significant risk of loss, so consider your own situation and consult a licensed advisor before you trade.
Proptary editorial team independently reviews prop trading firms, verifies payouts, and explains the rules that decide who keeps an account. We disclose affiliate relationships and publish methodology for every score.