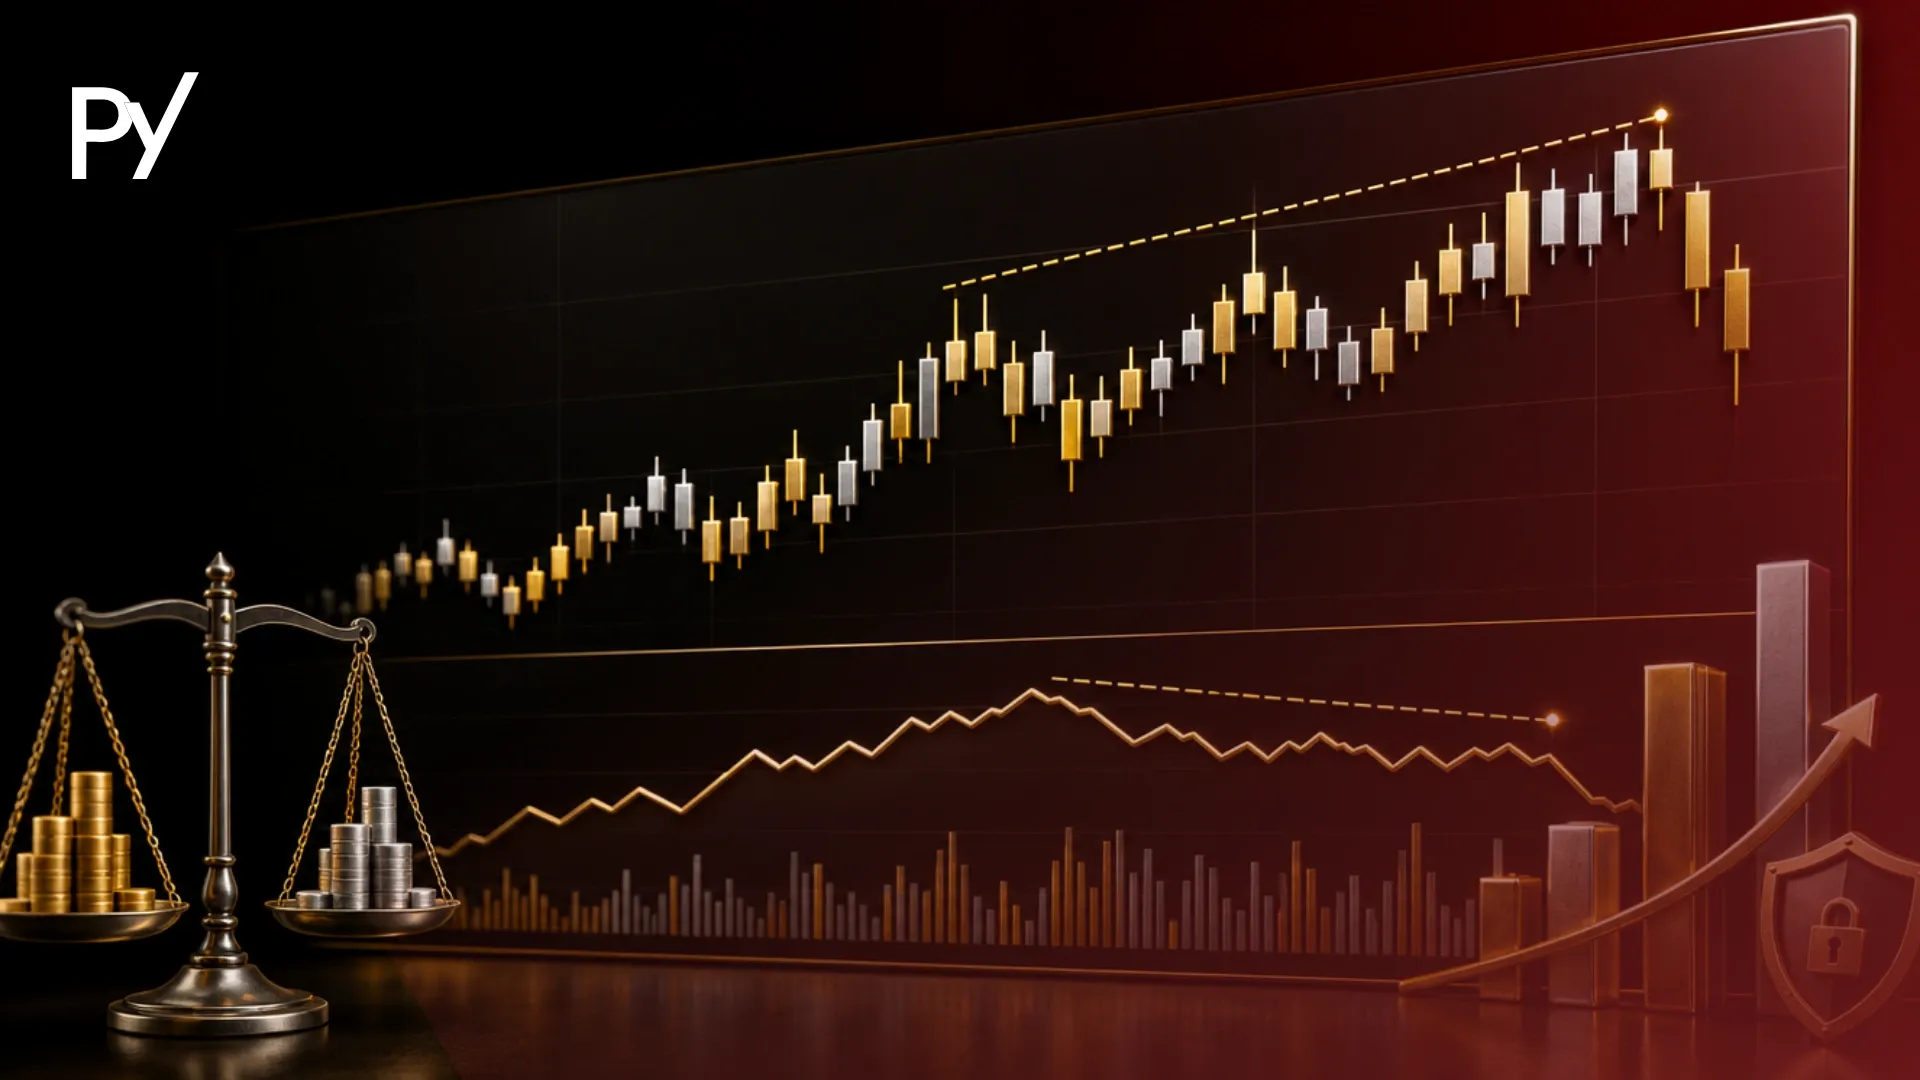
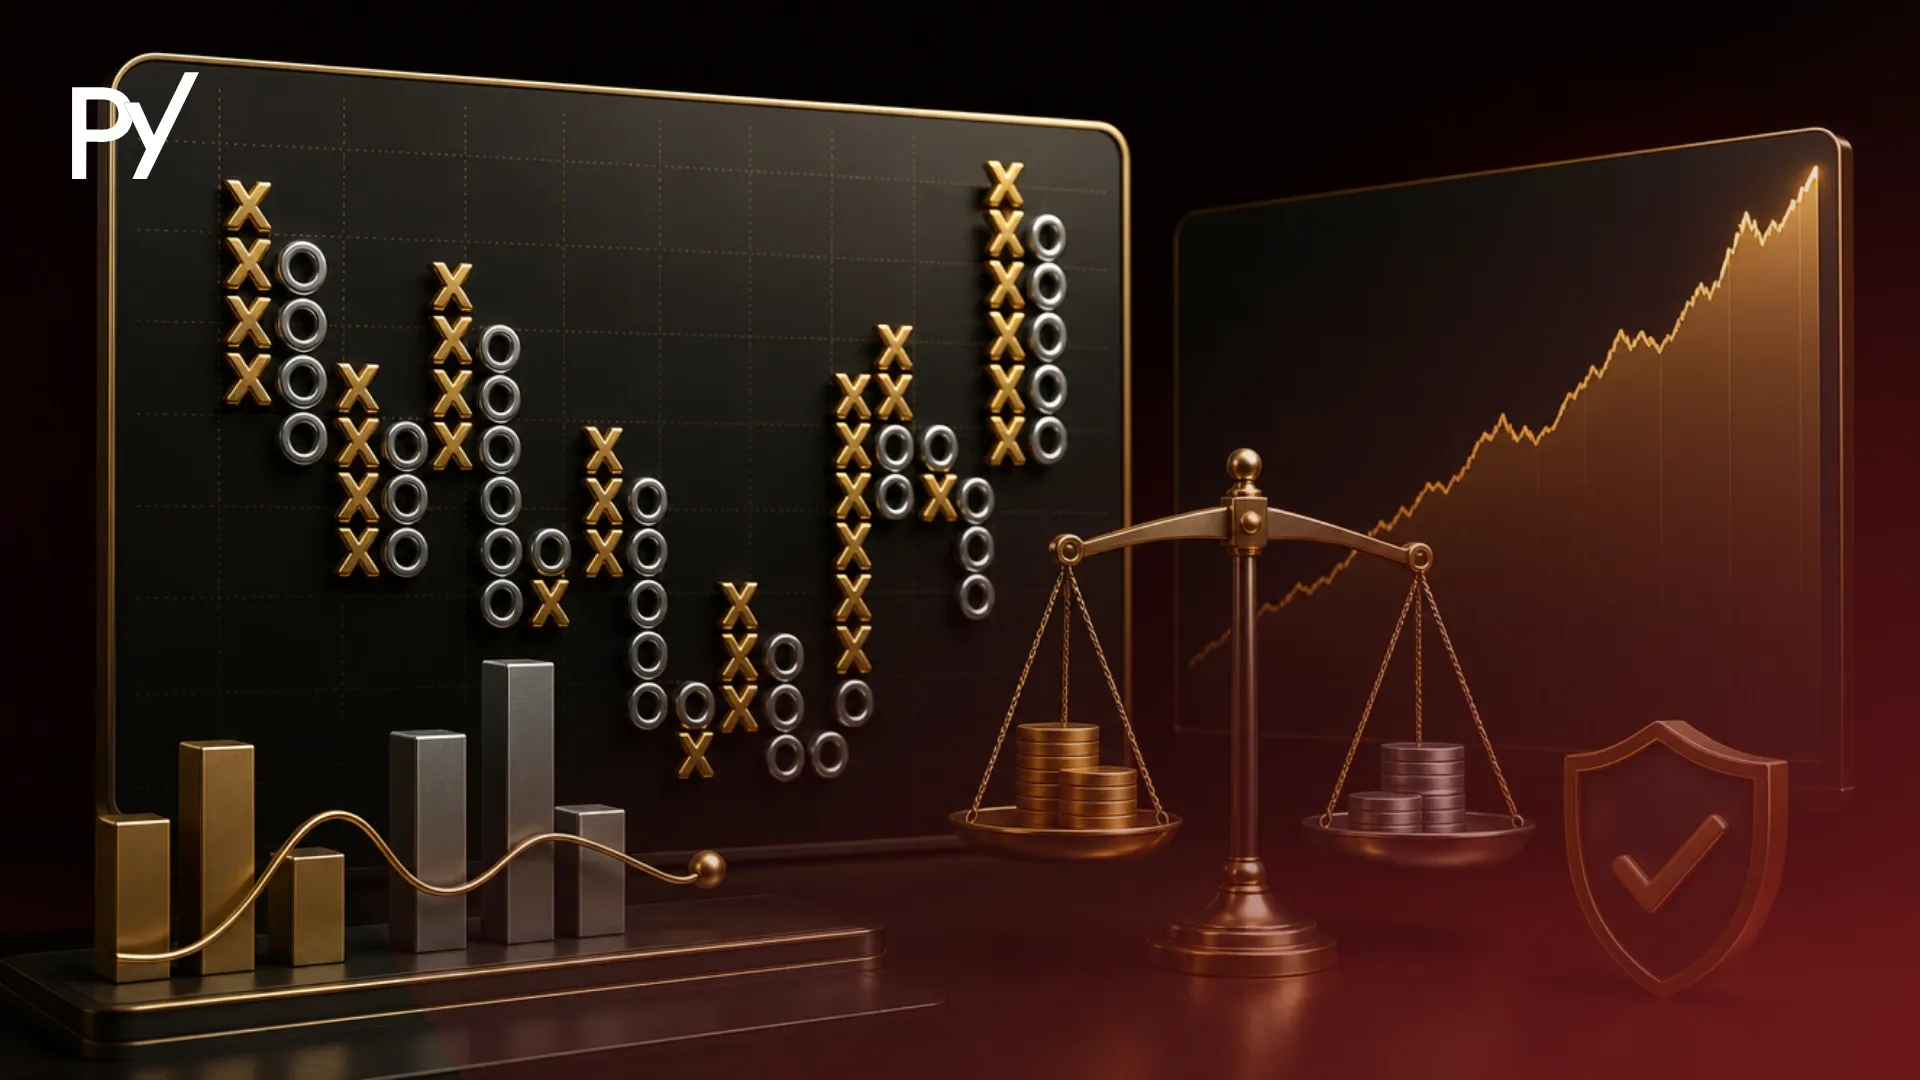
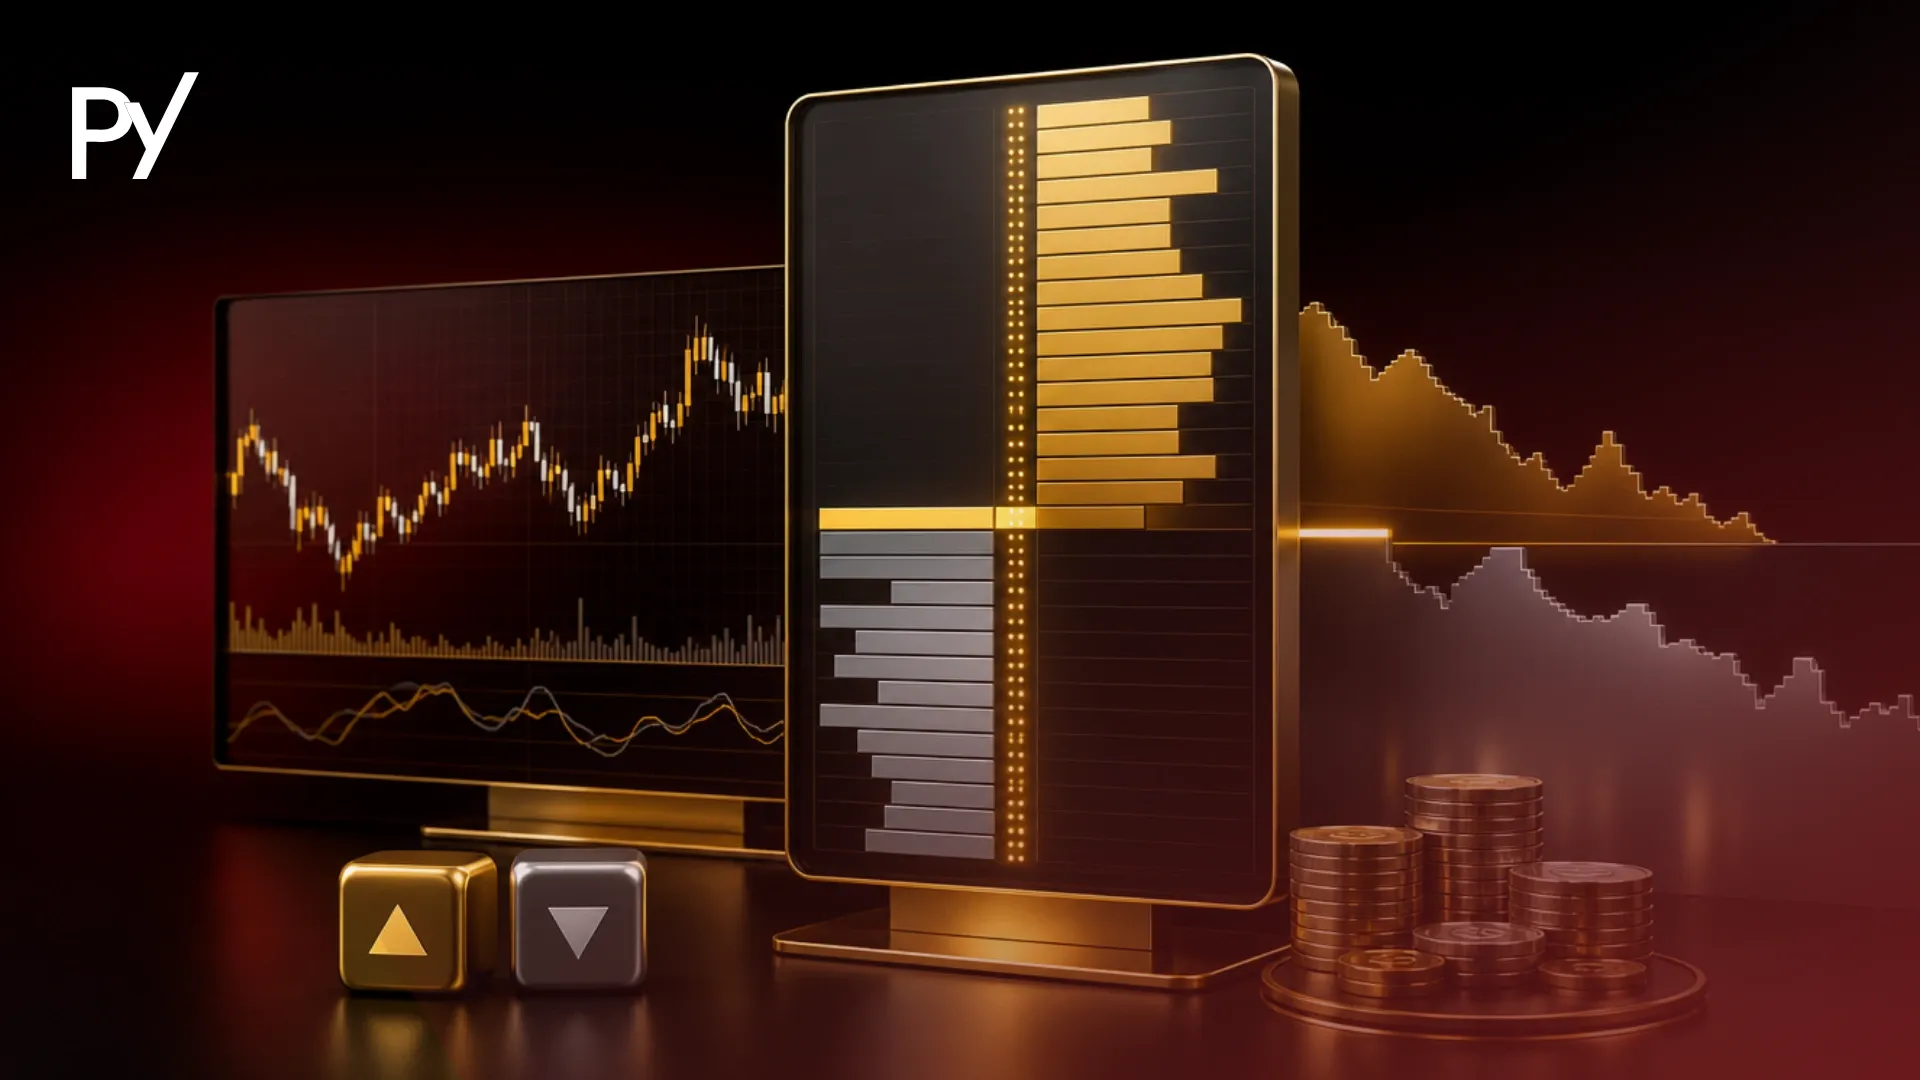
The Wyckoff Method evaluates market structure and price-volume relationships across four phases: Accumulation, Markup, Distribution, and Markdown. Prop traders analyze structural events like Phase C Springs and Last Points of Support to align entries with institutional order flow, ensuring high-probability execution while keeping stop-loss placement aligned with strict funded account drawdown parameters.
The Wyckoff method is a technical analysis and market structure framework that analyzes institutional supply and demand dynamics, price cycles, and volume validation to identify high-probability trend entries and distribution reversals.
Many prop traders fail by treating Wyckoff schematics as static chart patterns, buying Phase B range midpoint chop or getting wiped out when deep liquidity sweeps breach tight daily drawdown limits.
Understanding how institutional participants accumulate and distribute inventory allows funded traders to align entries with true market structure while protecting account capital. This guide breaks down the 3 laws, Phase A through E schematics, and execution rules for funded accounts.
What Is the Wyckoff Method?
The Wyckoff method is a technical analysis and market structure framework developed by Richard D. Wyckoff that maps institutional supply and demand to forecast future price direction. Pioneered in the early 20th century, the Wyckoff trading method operates on the principle that market price movements are not random, but are instead driven by large institutional market participants operating in repeatable structural cycles.
To simplify how large institutions move price, Wyckoff introduced the concept of the "Composite Man." The Composite Man is a conceptual entity representing the collective actions of institutional operators, central banks, hedge funds, and liquidity providers. In theory, the Composite Man carefully plans, executes, and concludes market campaigns:
Accumulation: Silently purchasing large quantities of an asset at wholesale prices within a tight trading range without driving price upward.
Markup: Pushing price higher into an uptrend once retail supply is fully absorbed.
Distribution: Unloading collected positions to retail buyers at retail prices near market tops.
Markdown: Allowing price to fall rapidly once institutional buying support is completely withdrawn.
For prop traders, understanding this institutional cycle is essential for contextualizing price movement. Relying solely on pure price action trading without analyzing institutional volume or market phase often leaves traders vulnerable to stop hunts and false breakouts. Wyckoff technical analysis provides the underlying supply and demand rationale behind why support and resistance levels hold or fail.
The 3 Fundamental Laws of Wyckoff Trading
The three fundamental laws of the Wyckoff method — Supply and Demand, Cause and Effect, and Effort vs. Result — govern all market movements by measuring order flow imbalances, consolidation duration, and volume validation.
The 3 Laws of the Wyckoff Method:
Supply & Demand — price direction
Cause & Effect — trend potential
Effort vs. Result — volume vs. spread
1. The Law of Supply and Demand
This law states that price moves in the direction of the dominant order flow imbalance:
Demand > Supply: Price rises.
Supply > Demand: Price falls.
Supply = Demand: Price consolidates in a trading range with low volatility.
Wyckoff traders measure this imbalance by analyzing candlestick spreads and order flow volume at key range boundaries, rather than relying on delayed mathematical oscillators.
2. The Law of Cause and Effect
The Law of Cause and Effect establishes that the magnitude of a trend (Effect) is directly proportional to the duration and density of the preceding consolidation range (Cause).
In Wyckoff theory, a prolonged horizontal range represents institutional inventory building. The longer the Composite Man spends accumulating or distributing assets inside a range, the larger the eventual breakout trend will be. For funded account traders, this law helps set realistic profit targets based on range width and duration, preventing premature exits during strong expansion phases.
3. The Law of Effort vs. Result
This law compares trade volume (Effort) with price movement spread (Result) to identify institutional absorption or exhaustion:
Harmony: High volume paired with a wide-range candlestick indicates true institutional backing behind the directional move.
Divergence: High volume paired with a narrow-range candlestick indicates institutional absorption — large orders are being filled against the prevailing move, signaling an impending market reversal.
Combining price spread analysis with toolsets like volume profile trading allows traders to verify whether high volume at range boundaries represents genuine breakout momentum or institutional accumulation stopping a trend.
The Wyckoff Market Cycle: Accumulation to Distribution
The Wyckoff market cycle tracks the continuous transfer of financial assets between institutional operators and retail market participants across four distinct stages: Accumulation, Markup, Distribution, and Markdown.
Accumulation Phase: Price consolidates after a prolonged downtrend. The Composite Man absorbs remaining sell orders from panicked retail traders. Volatility compresses, and lower range boundaries are repeatedly tested to sweep sell-side liquidity.
Markup Phase: Once institutional supply is cleared, demand overwhelms remaining sell orders. Price breaks out above range resistance, establishing a sustained uptrend characterized by higher highs and higher lows.
Distribution Phase: Following a substantial markup, price enters a high-volatility horizontal range. Institutional participants quietly sell off their inventory to late-entering retail buyers driven by fear of missing out (FOMO).
Markdown Phase: With institutional buying support completely depleted, excess supply forces price into a rapid downtrend. Price breaks below range support, triggering stop losses and resetting the market cycle.
Identifying the transition boundaries between consolidation (Cause) and expansion (Effect) enables traders to position themselves early in high-reward legs while avoiding range-bound chop.
Anatomy of a Wyckoff Schematic: Phase A Through Phase E
A Wyckoff schematic divides market range development into five sequential phases (Phase A through Phase E) to identify the exact progression of institutional inventory absorption and breakout preparation.
Phase A: Stopping the Prior Trend
Phase A marks the deceleration and temporary halt of the preceding trend.
Preliminary Support/Supply (PS/PSY): The first sign of institutional buying or selling entering an aggressive trend, causing a brief pause.
Selling/Buying Climax (SC/BC): Extreme price spread and spike in volume as retail panic triggers mass stop-out market orders, absorbed entirely by institutions.
Automatic Reaction (AR): A sharp bounce caused by short covering or profit-taking, setting the upper boundary of an accumulation range (or lower boundary of distribution).
Secondary Test (ST): Price retests the climax zone on reduced volume and narrower spread to confirm that selling or buying pressure is dissipating.
Phase B: Building the Cause
Phase B is typically the longest structural phase, designed to absorb remaining supply or demand within the trading range. Institutions test price at both boundaries, creating false breakouts to trap impatient participants.
Phase C: The Liquidity Sweep (Spring / UTAD)
Phase C represents the definitive test of remaining market inventory before a sustained trend begins:
Spring: In accumulation, price breaks below Phase A support to sweep retail sell-stop liquidity below the range, immediately recovering back inside the range on strong volume.
Upthrust After Distribution (UTAD): In distribution, price pushes above range resistance to trap late buyers and trigger buy-stops before aggressively falling back into the range.
Phase D: Structural Breakout
Phase D confirms institutional control through structural shifts:
Sign of Strength / Weakness (SOS / SOW): A decisive price expansion move across the range boundary on expanding volume.
Last Point of Support / Supply (LPS / LPSY): A low-volume pullback to former range resistance (now support) or former support (now resistance) providing a conservative entry location.
Phase E: Trend Expansion
Price exits the schematic structure completely, entering an open-market Markup or Markdown trend.
Why the Wyckoff Method Matters for Prop Traders
Applying Wyckoff method trading techniques gives prop traders a non-lagging structural map to time low-risk entries while navigating strict daily drawdown limits and consistency rules.
Prop firms operate under non-negotiable risk parameters — typically a 3% to 5% daily drawdown limit and a 6% to 10% maximum trailing or static drawdown. Attempting to trade arbitrary support and resistance levels without market cycle context frequently leads to rapid account breaches during institutional liquidity sweeps.
Structural Phase
Prop Risk Strategy
Phase B Range Midpoint
Avoid — high chop & drawdown risk
Phase C Spring / UTAD
Aggressive — high R:R, tight buffer
Phase D LPS / LPSY
Conservative — confirmed structure
By filtering setups through Wyckoff phases, prop traders can optimize risk-to-reward ratios:
Phase C Entries (Springs/UTADs): Offer maximum risk-to-reward ratios by entering right after liquidity has been swept, allowing tight stop placement just beyond the extreme sweep wick.
Phase D Entries (LPS/LPSY): Offer higher win rates by waiting for a confirmed Sign of Strength/Weakness before entering on the first structural pullback.
When trading a Phase C Spring on a funded account, never place your stop loss directly below the range lows where the liquidity pool sits. Many institutional sweeps extend 10 to 15 pips past structural support to clear out retail stops before reversing; sizing position risk down so your stop can comfortably sit beyond the deep sweep buffer prevents an unnecessary daily drawdown breach.
Furthermore, identifying Phase B consolidation prevents funded traders from overtrading inside range midpoints. Range chop grinds down account balance through spread costs and commission fees, risking inactivity penalties or consistency rule violations.
Common Wyckoff Traps That Blow Funded Accounts
The primary Wyckoff traps that blow funded accounts stem from entering trades prematurely during Phase B range consolidation, misinterpreting deep Phase C sweeps, and relying on unvalidated tick volume.
Trap 1: Early Entry in Phase B Midpoint
Phase B is characterized by range chop, false moves, and persistent whipsaws designed to liquidate retail traders. Buying or selling near the midpoint of an unconfirmed Wyckoff range frequently leads to consecutive stop-outs, eroding daily drawdown allowances before the actual Phase C Spring or UTAD occurs.
Trap 2: Misidentifying a Deep Spring vs. True Markdown
Not every support breakdown is a Wyckoff Spring. If price breaks support on expanding volume and wide price spread without quickly reclaiming the range, it indicates a genuine structural Markdown trend rather than a liquidity sweep. Attempting to "catch the falling knife" by treating a real breakdown as a Spring can cause a catastrophic loss that breaches daily drawdown limits.
Trap 3: Relying on Spot Forex Tick Volume Without Price Context
Spot FX markets do not feature a centralized exchange, meaning MetaTrader tick volume measures price tick updates rather than actual traded contract volume. Relying strictly on spot FX tick volume to evaluate Wyckoff Effort vs. Result can distort signal accuracy. Funded forex traders must cross-reference price spread, multi-timeframe candle closes, and CME futures volume data where available to validate institutional absorption accurately.
Mastering Wyckoff Structure for Funded Accounts
Mastering the Wyckoff method provides prop traders with a structured framework for reading institutional order flow and executing trades in alignment with market cycles. Rather than guessing reversals or buying into breakout traps, Wyckoff mechanics allow you to wait for clear Phase C liquidity sweeps or Phase D structural confirmations before committing capital.
Protecting a funded account requires balancing aggressive entry timing against strict daily drawdown limits — prioritizing high-probability Phase D setups during volatile market conditions.
FAQ
What are the 3 main laws of the Wyckoff method?
The three laws are Supply and Demand, Cause and Effect, and Effort vs. Result. Supply and Demand determines price direction based on order flow imbalance. Cause and Effect links consolidation duration to subsequent trend distance. Effort vs. Result compares trade volume against price spread to detect institutional absorption or exhaustion.
What is the difference between Wyckoff accumulation and distribution?
Accumulation occurs after a downtrend when institutional buyers absorb market supply at wholesale prices inside a range, preparing for a bullish markup. Distribution occurs after an uptrend when institutions unload positions to retail buyers at peak prices, building sell-side inventory before a bearish markdown trend begins.
What is a Wyckoff Spring and how do you trade it safely?
A Wyckoff Spring is a Phase C false breakdown below accumulation range support designed to sweep retail stop-loss liquidity. To trade it safely on a funded account, wait for price to quickly reclaim range support on strong volume, placing stop losses beyond the sweep wick with reduced position sizing to protect daily drawdown limits.
Can you use the Wyckoff method on spot forex tick volume?
Yes, but with limitations. Spot forex lacks a centralized exchange, so MetaTrader tick volume measures price updates rather than contract volume. While tick volume correlates well with activity during active sessions, prop traders should cross-reference price spread, multi-timeframe candle closes, and CME futures volume data for reliable volume validation.
How does the Wyckoff method differ from pure price action?
Pure price action focuses primarily on candlestick patterns, support and resistance levels, and geometric chart shapes. The Wyckoff method adds institutional context by analyzing price spread alongside volume to measure supply and demand imbalance, helping traders distinguish between genuine breakout momentum and false liquidity sweeps.
Disclaimer
Disclaimer: This guide was written with AI assistance, reviewed for accuracy by the Proptary editorial team, and kept up to date. It's for education only — not financial advice. Prop trading and the financial markets carry a significant risk of loss, so consider your own situation and consult a licensed advisor before you trade.
Proptary editorial team independently reviews prop trading firms, verifies payouts, and explains the rules that decide who keeps an account. We disclose affiliate relationships and publish methodology for every score.