Volume Profile trading is an analytical method that plots transacted trade volume horizontally across price levels to reveal institutional fair value consensus and thin liquidity areas. Unlike traditional time-based vertical volume, horizontal volume highlights the Point of Control and Value Area boundaries where price acceptance or rejection occurs. Funded traders use these structural liquidity nodes to plan high-probability mean-reversion trades.
Volume profile trading is an analysis technique that displays horizontal transaction volume across specific price levels over a given timeframe, revealing institutional fair value zones and price rejection areas.
Most funded account traders fail by placing market orders inside thin liquidity zones where execution slippage triggers daily loss limits. Understanding horizontal volume distribution allows you to identify where market participants accept or reject price before entering a position.
This guide breaks down core Volume Profile mechanics, high-probability trade setups, and risk management rules designed for evaluation constraints.
What Is Volume Profile Trading? (Core Definition & Mechanics)
Volume Profile trading is the process of mapping market liquidity and fair value by tracking the exact volume of contracts transacted at specific price points rather than across time intervals.
Traditional charts display time-based volume at the bottom of the screen, showing how many contracts traded during a five-minute or daily candle. However, vertical volume fails to show where those trades took place within the candle's range.
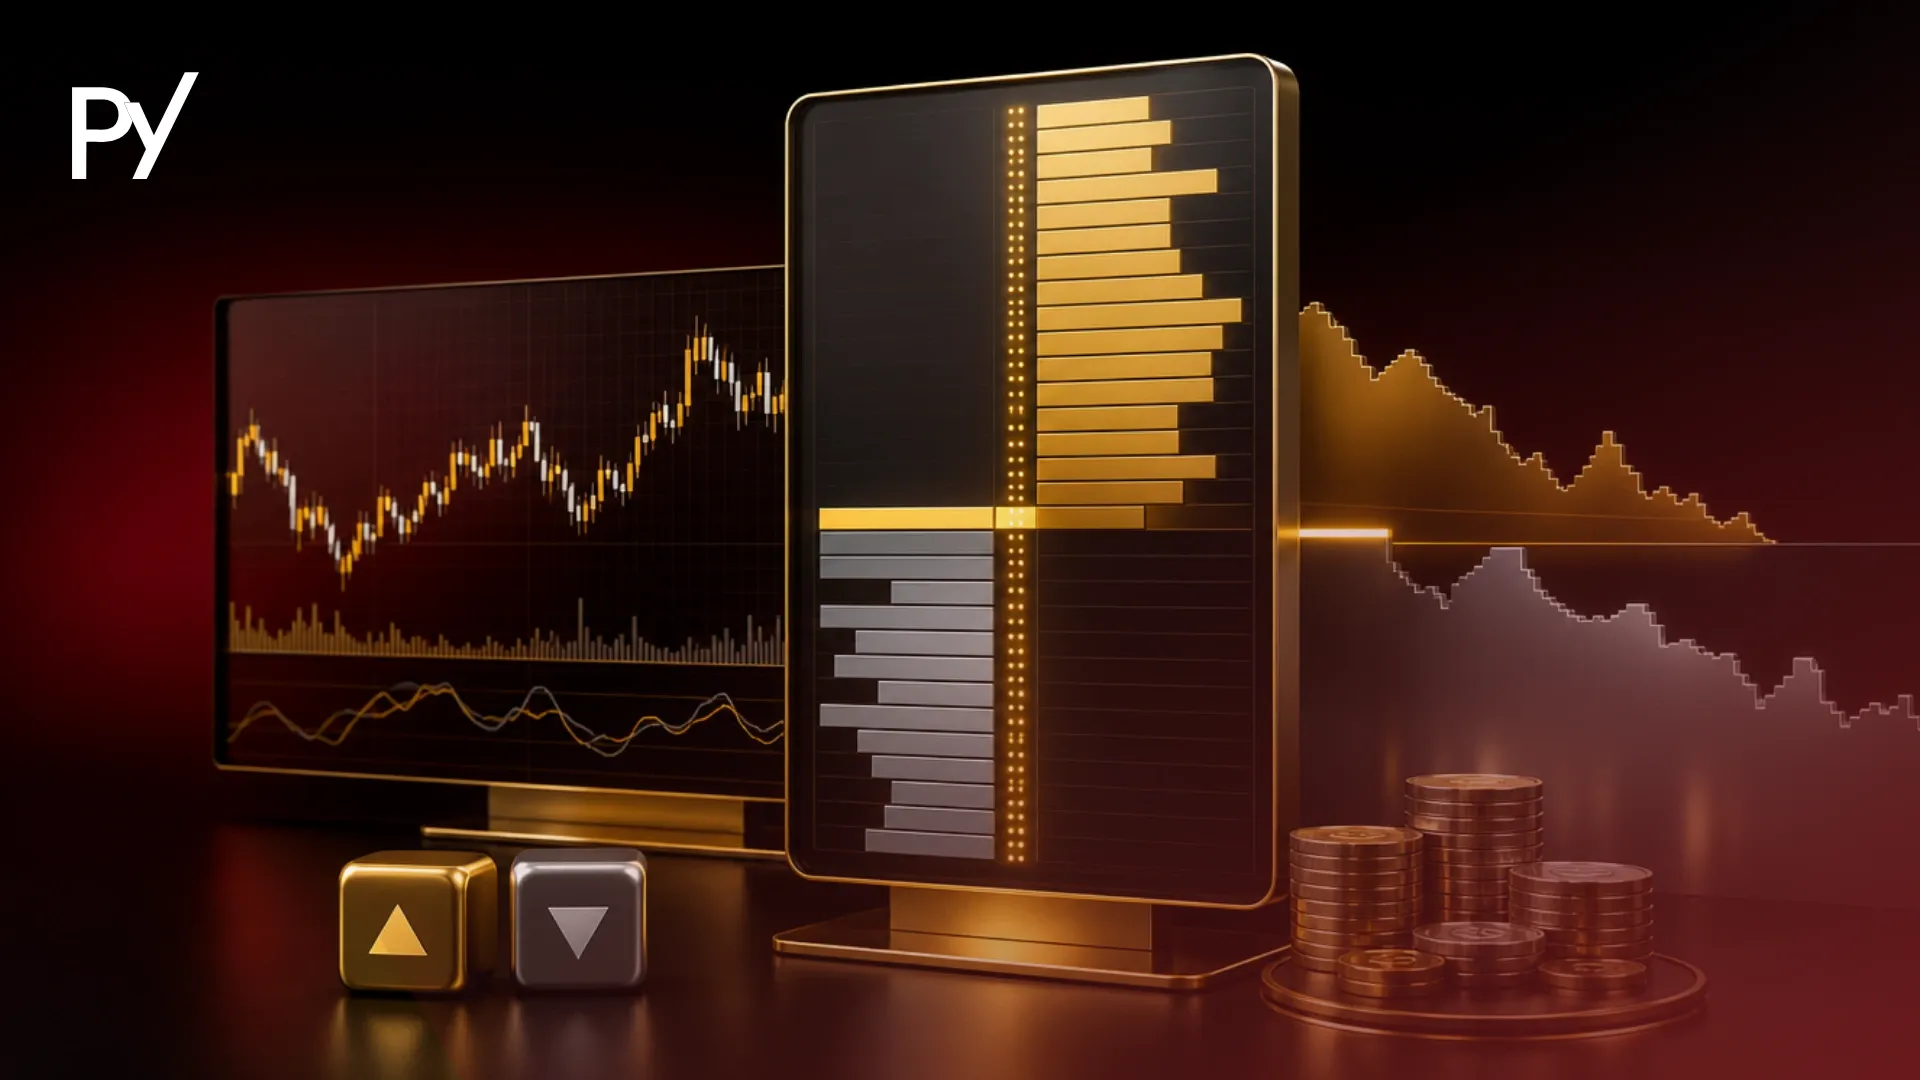
Analyzing a trading volume profile shifts the axis 90 degrees, plotting a horizontal histogram directly alongside price. This structure isolates institutional accumulation zones from areas where price moved rapidly due to a lack of liquidity.
It is critical to distinguish historical transacted volume from active order book depth. A Volume Profile records orders that have already been executed and matched. It does not display pending limit orders waiting in the depth-of-market ladder.
While high transacted volume indicates past consensus between buyers and sellers, it does not guarantee that institutional limit orders will remain at that price level when price returns.
To utilize Volume Profile effectively in a funded trading environment, you must understand its core structural components:
Point of Control (POC): The single price level within a specified session or range that recorded the highest transacted volume. The POC represents the market's ultimate fair value consensus for that timeframe.
Value Area (VA): The price range where a predefined percentage of total session volume was transacted, typically set to approximately 68%, based on a standard statistical normal distribution.
Value Area High (VAH): The highest price boundary within the Value Area. Prices above VAH are considered premium relative to the session's core auction.
Value Area Low (VAL): The lowest price boundary within the Value Area. Prices below VAL are considered discounted relative to the core auction.
High Volume Nodes (HVN): Prominent horizontal peaks on the profile where heavy commercial trading took place. HVNs act as market magnets and consolidation zones where price slows down and ranges.
Low Volume Nodes (LVN): Pronounced horizontal valleys on the profile where minimal volume transacted. LVNs represent price levels that the market rejected quickly, acting as structural resistance or high-velocity transition corridors.
Volume Profile vs. Market Profile Trading
Volume Profile tracks the actual quantity of transacted contracts at price, whereas Market Profile measures the duration of time price spent at a given level using Time-Price Opportunities (TPOs).
While both tools originate from Auction Market Theory, they evaluate market structure through fundamentally different lenses. Market Profile assigns a letter (TPO) to each half-hour trading bracket where price trades. If price trades at a single level for three hours, Market Profile records heavy TPO accumulation, regardless of whether 100 contracts or 10,000 contracts were executed.
Volume Profile ignores time completely and focuses exclusively on total transacted volume. A single institutional block trade executed in milliseconds inside a low-volatility range will create a massive High Volume Node on a Volume Profile, while a Market Profile chart might show a thin single-print tail.
Funded traders often pair Volume Profile with Market Profile trading concepts to differentiate between time-based acceptance and actual institutional positioning. When price spends substantial time at a price level without accumulating horizontal volume, it signals low-conviction retail participation.
Conversely, heavy volume transacted quickly across tight price levels signals aggressive institutional positioning, creating key structural levels that can be incorporated into a broader market analysis.
Core Volume Profile Trading Strategies for Funded Accounts
Executing a Volume Profile trading strategy within a funded account requires filtering setups by location relative to fair value to protect daily drawdown limits.
Prop firm evaluation rules punish chaotic over-trading and large single-day losses. By anchoring your execution to the Value Area and liquidity nodes, you can deploy volume profile trading strategies that offer clearly defined stop-loss placement and high reward-to-risk ratios.
Strategy 1: Mean Reversion to Point of Control (POC Reversion)
When the market trades in an established balance zone, price frequently probes outside the Value Area boundaries before returning to fair value.
Entry: Wait for price to extend outside the Value Area High (VAH) or Value Area Low (VAL). Look for a price action rejection candle (such as a pin bar or failed breakout pattern) closing back inside the Value Area.
Target: The Point of Control (POC) serves as your primary profit target, representing the highest-probability mean-reversion objective.
Stop-Loss: Place your stop-loss just beyond the structural swing high or low outside the Value Area. This structure maintains a tight risk profile suitable for prop firm daily drawdown parameters.
Low Volume Nodes represent price ranges where the auction market transacted rapidly due to an imbalance between aggressive buyers and sellers. Because liquidity inside an LVN is thin, price tends to slice through these pockets quickly when retested.
Entry: Identify a distinct LVN sitting between two High Volume Nodes (HVNs). Enter a momentum order as price breaks through the LVN boundary in the direction of the macro trend.
Target: The far edge of the LVN, targeting the immediate POC or HVN on the opposite side.
Stop-Loss: Place your stop-loss back inside the origin HVN consolidation zone. If price re-enters the high-volume node, the breakout hypothesis is invalidated.
Strategy 3: Value Area Acceptance (The 80% Rule)
Originating from floor trading statistical models, the 80% Rule states that if price opens or moves outside the previous session's Value Area, and subsequently pushes into the Value Area and accepts for two consecutive 30-minute periods, historically, price has tended to trade all the way through to the opposite Value Area boundary in roughly 80% of observed instances — though this is not a guaranteed outcome
Entry: Confirm two consecutive 30-minute candle closes inside the prior session's Value Area after trading outside it.
Target: The opposite Value Area boundary (VAH to VAL, or VAL to VAH).
Stop-Loss: Place your stop-loss just beyond the session open or the swing low/high established outside the Value Area.
Many funded traders make the mistake of setting tight stop-losses directly inside Low Volume Nodes. Because price moves through thin liquidity pockets with extreme velocity, spread expansion inside LVNs almost always triggers slippage that breaches maximum daily loss limits before the trade can recover.
Common Mistakes & Funded Account Traps
The most dangerous Volume Profile traps stem from misinterpreting historical execution nodes as static support lines and ignoring broker slippage in low-liquidity zones.
While LVNs provide explosive momentum setups, they carry substantial execution risk for prop firm accounts. Because limit order depth is thin inside LVN corridors, market orders placed during high-volatility sessions suffer severe slippage. If your prop firm enforces a strict maximum daily drawdown based on equity or balance, entering with market orders inside an LVN can cause fill slippage that immediately breaches your loss threshold.
Trap 2: Anchoring Bias on the Point of Control (POC)
Retail traders frequently treat the Point of Control as an absolute pivot line, attempting to short every retest of a POC during strong trending conditions. During institutional impulse moves, the market continuously rejects old fair value levels as buyers or sellers seek higher or lower prices. Blindly fading a POC during a high-momentum trend day leads to consecutive losing trades that quickly exhaust your evaluation drawdown allowance.
Trap 3: Confusing Transacted Volume with Active Limit Support
A high volume node indicates that heavy transaction activity occurred at that price in the past. It does not mean large buyers or sellers are sitting there with passive limit orders today. Relying on historical HVNs without confirming real-time order flow leaves your account vulnerable to aggressive institutional sweeps that clear out old volume nodes without stopping.
Analyzing Volume Profile
Volume Profile trading provides funded traders with an objective visual map of market auction dynamics, highlighting fair value accumulation zones and low-liquidity rejection levels. By focusing entries around Value Area boundaries and managing trade sizing near Low Volume Nodes, you can establish high-reward setups that respect strict prop firm daily drawdown limits.
FAQ
What is the difference between Volume Profile and traditional volume indicators?
Traditional volume indicators display transacted volume vertically based on time increments, showing how many contracts traded during a specific candle. Volume Profile plots volume horizontally across price levels, revealing exactly where transactions occurred. This horizontal orientation helps traders isolate institutional price acceptance from low-liquidity transition zones regardless of how much time price spent at those levels.
What is the Point of Control (POC) in volume profile trading?
The Point of Control (POC) is the single price level within a specified trading session or range that recorded the highest total transacted volume. It represents the ultimate market consensus on fair value. Traders view the POC as a strong magnet during mean-reversion conditions and use it as a primary profit target when trading rejections from Value Area boundaries.
How does the 80% Rule work in volume profile trading?
The 80% Rule states that if price opens or extends outside the previous session's Value Area, re-enters that Value Area, and accepts for two consecutive 30-minute time brackets, there is an 80% probability it will trade all the way through to the opposite Value Area boundary. Funded traders use this setup to capture structured range rotations.
What is a Low Volume Node (LVN) and why is it risky for funded accounts?
A Low Volume Node (LVN) is a price level where minimal transaction volume occurred, signaling rapid rejection by market participants. Because active limit order depth inside LVNs is thin, price tends to slice through them quickly. Entering with market orders near LVNs carries high execution slippage risk that can instantly breach strict prop firm daily loss limits.
How do prop traders use volume profile to prevent drawdown breaches?
Prop traders use Volume Profile to anchor risk placement around structural fair value rather than arbitrary pip distances. By entering mean-reversion trades at Value Area High or Low boundaries and targeting the Point of Control, traders keep stop-losses tight outside fair value zones. This asymmetric risk profile prevents excessive loss accumulation inside strict daily and trailing drawdown parameters.
Disclaimer
Disclaimer: This guide was written with AI assistance, reviewed for accuracy by the Proptary editorial team, and kept up to date. It's for education only — not financial advice. Prop trading and the financial markets carry a significant risk of loss, so consider your own situation and consult a licensed advisor before you trade.
Proptary editorial team independently reviews prop trading firms, verifies payouts, and explains the rules that decide who keeps an account. We disclose affiliate relationships and publish methodology for every score.