The ICT trading strategy is a price-action methodology that targets institutional liquidity pools and fair value gaps rather than traditional chart patterns. It uses precise setups, such as the 2022 Mentorship model, during high-volume time windows called killzones. Its tight stop-losses require strict risk management to avoid breaching a prop firm's daily loss limit.
The ICT trading strategy is a price-action framework designed to identify where institutional liquidity sits and how price moves to capture it before reversing.
For prop firm applicants, it is a widely used methodology for passing evaluations because it provides strict, time-based entry models. However, the exact mechanics that make it popular (tight invalidation levels and high reward-to-risk ratios) are also what cause many traders to breach daily loss limits. This guide covers the core components of the strategy, the exact entry sequence, and how to execute it without triggering a simulated account's drawdown rules.
What Is the ICT Trading Strategy?
If you are wondering exactly what is ICT trading strategy, it is a comprehensive market structure methodology developed by Michael J. Huddleston, known as The Inner Circle Trader. The ICT trading strategy meaning revolves around the premise that the financial markets are not driven by random buying and selling pressure, but are instead engineered to seek out areas of high liquidity.
Instead of looking for retail chart patterns like head-and-shoulders or double tops, ICT traders analyze the chart to find where standard retail stop-losses are resting. The strategy operates on the idea that price will sweep these stop-loss clusters to build enough volume before rapidly reversing into the true intended direction. Once that reversal happens, the strategy looks for inefficiencies left behind in the price delivery, providing a mechanical entry point to join the new trend.
While often wrapped in heavy terminology, at its core, the strategy is a highly disciplined approach to reading supply, demand, and time. It requires you to wait for very specific criteria to align, completely ignoring price action outside of designated trading hours.
Core Components of ICT Market Structure
To trade the methodology effectively, you need to understand its foundational building blocks. These elements form the architecture of every setup, shifting the focus from lagging indicators to raw price delivery. Understanding these components is essential for effective market structure trading.
Buy-Side and Sell-Side Liquidity (BSL/SSL) Liquidity simply refers to areas on the chart where a large number of pending orders exist. Buy-Side Liquidity (BSL) rests above old highs: this is where short sellers place their buy-stop loss orders, and breakout traders place their buy-stop entry orders. Sell-Side Liquidity (SSL) rests below old lows, holding the sell-stop orders of long traders. The strategy anticipates that price will intentionally spike through these levels to trigger the orders, a process known as a liquidity sweep.
Displacement After a liquidity sweep, the market must show a sudden, high-momentum move in the opposite direction. This is called displacement.
It is characterized by large, full-bodied candlesticks that aggressively break previous structural levels. Displacement is the signal that the sweep was successful and that institutional-level volume has entered the market. If price slowly drifts away from a swept high or low, it is not displacement, and the setup is invalid.
Fair Value Gaps (FVG) When displacement occurs, the price moves so fast that it creates an inefficiency in the market. A Fair Value Gap (FVG) is a three-candle pattern where the first and third candles do not overlap, leaving a gap in the price delivery of the second candle. The strategy dictates that the market will eventually retrace to fill this gap, offering the optimal entry point before the price continues in the direction of the displacement.
The ICT 2022 Mentorship Entry Model
The most widely adopted execution sequence is the 2022 Mentorship model. Having the ICT trading strategy explained sequentially reveals that it is not about predicting the top or bottom of a move, but waiting for a very specific chain of events to occur. The entire model relies on patience and strict adherence to the sequence.
Wait for the Liquidity Sweep: First, identify a clear pool of Buy-Side or Sell-Side Liquidity on a higher timeframe chart, such as the 15-minute or 1-hour. Wait for the price to spike through this level and immediately reject it. You are not entering the trade here; you are waiting for the trap to be set.
Identify the Market Structure Shift (MSS): Drop to a lower timeframe, such as the 1-minute, 3-minute, or 5-minute chart. After the liquidity sweep, look for a sharp displacement that breaks a recent swing point in the opposite direction. This break in market structure confirms that the trend is shifting.
Locate the Fair Value Gap: Within the displacement leg that caused the Market Structure Shift, identify the Fair Value Gap. This gap is the footprint of the heavy volume that initiated the reversal.
Execute on the Retest: Place a limit order at the beginning of the Fair Value Gap. Your stop-loss is placed just beyond the swing high or low that swept the liquidity. Your profit target is the next opposing liquidity pool.
This mechanical sequence is designed so that you typically enter the market only after other traders' stop-losses have been swept, which may offer a market-mechanics-based edge rather than relying on lagging indicators.
Timing the Market: ICT Killzones
A defining rule of the strategy is that you cannot trade the setups whenever they appear. Execution is strictly limited to specific windows of high volatility known as ICT killzones. These windows align with the opens of major global financial centers, ensuring that there is enough institutional volume to drive the displacement and hit the profit targets.
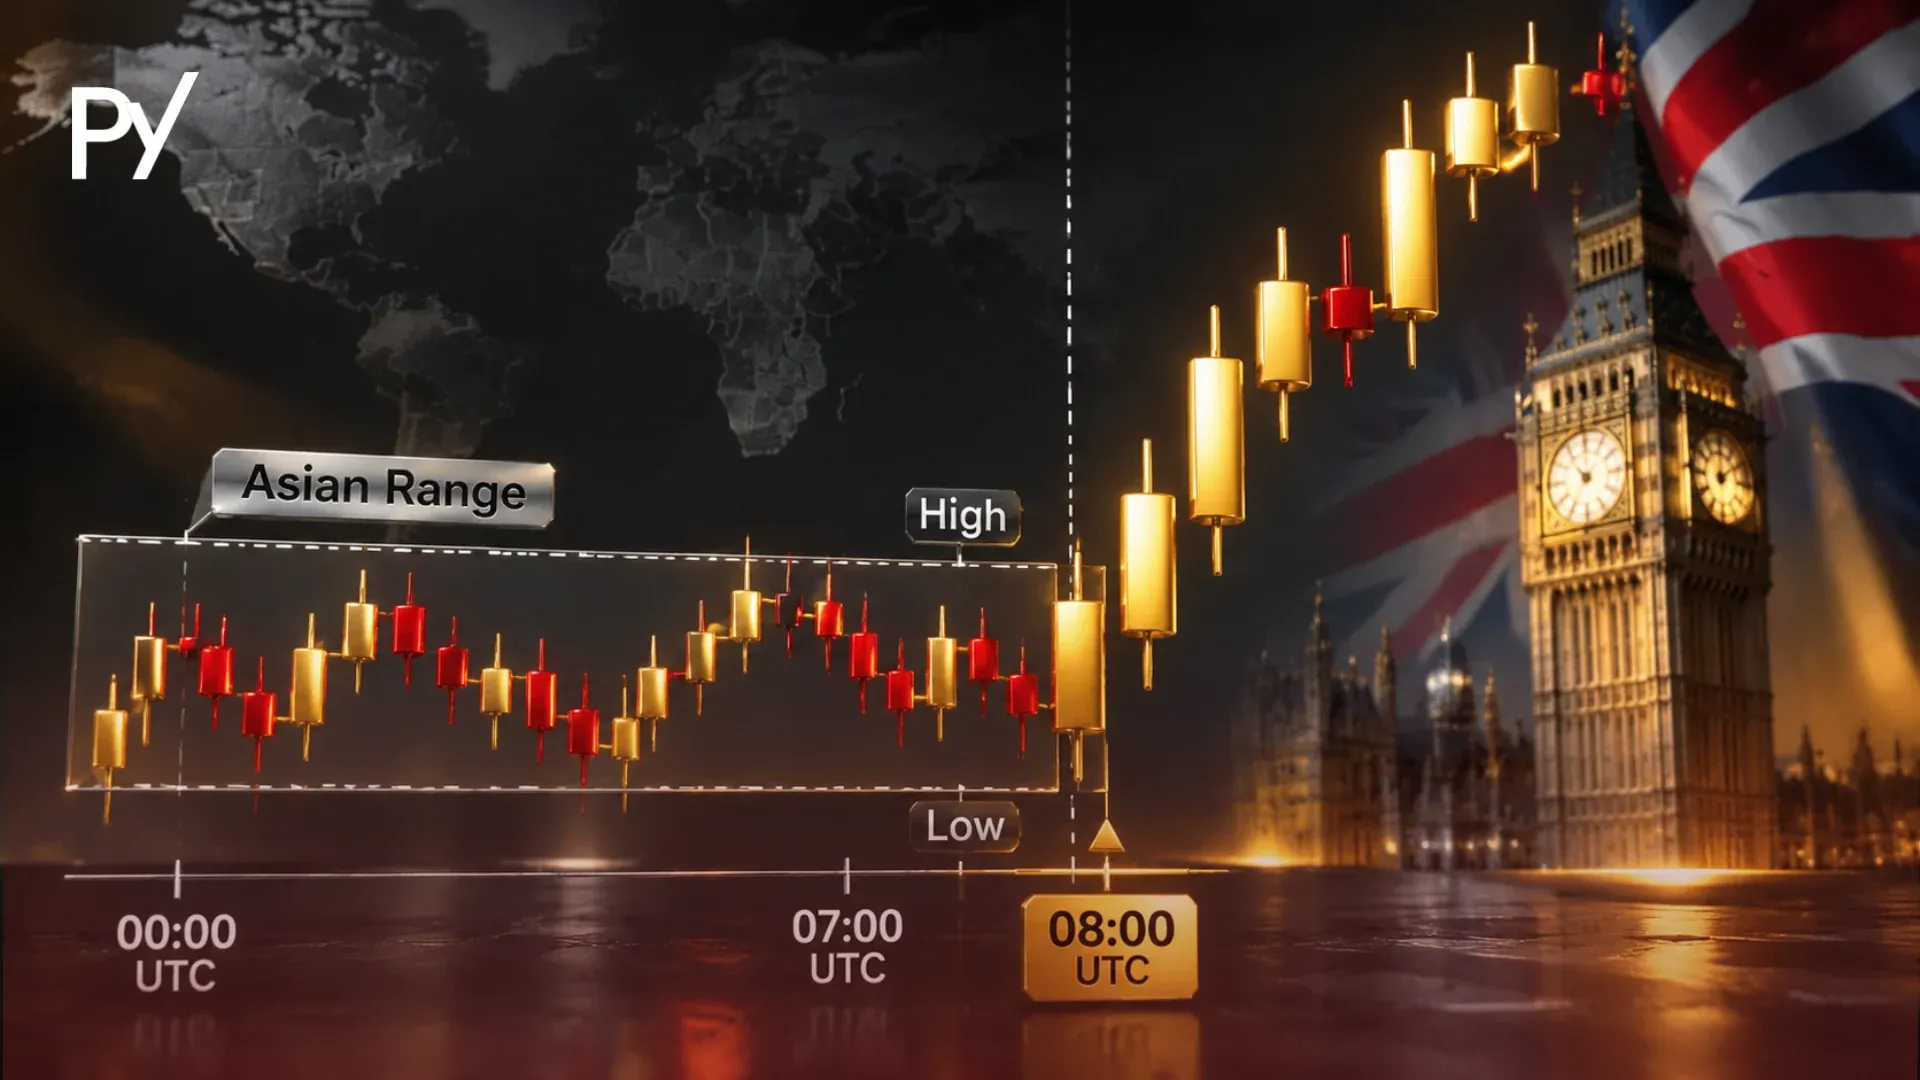
The primary windows are the Asian Range (consolidation phase), the London Open (often creates the high or low of the day), and the New York Open (provides heavy volume and trend continuation or reversal). Attempting to trade the 2022 model outside of these hours usually results in choppy, unpredictable price action that stops you out before reaching the target.
While killzones provide the necessary volatility, they also introduce a significant risk for prop firm traders. During the exact moments these killzones open, simulated prop firm feeds frequently experience severe spread widening and execution slippage. Because the entry model relies on precise strikes at a Fair Value Gap with very tight stop-losses, a widened spread at the New York open can easily trigger a stop-loss prematurely or slip an entry price, ruining the intended risk-to-reward ratio.
Why ICT Traders Fail Prop Firm Challenges
Despite its popularity, traders using this methodology fail prop firm challenges at the same high rates as retail pattern traders. The failure is rarely due to misunderstanding the chart; it is almost always a mathematical failure interacting with strict simulated prop rules.
The High Reward-to-Risk Trap The strategy inherently targets high reward-to-risk setups, often aiming for 1:3, 1:4, or 1:5 returns on a single trade. Mathematically, high R:R strategies naturally carry lower win rates.
A properly executed 2022 model tends to have a lower win rate, consistent with its high reward-to-risk design. Even when this is profitable over a long sample size, a lower win rate makes clusters of consecutive losses likely in the short term. If you suffer four straight losses risking 1% each, you are down 4%: which could immediately breach many prop firms' typical daily loss limit.
The math behind this is simple: at a 1:3 reward-to-risk ratio you break even at a 25% win rate, at 1:4 you break even at 20%, and at 1:5 at about 16.7%. A lower win rate can still be profitable, but it leaves less room for a losing streak inside a daily loss limit.
Trailing Drawdown Friction Many prop firms use a trailing drawdown that is calculated based on open equity highs. If you enter a trade at a Fair Value Gap and it runs 3% in profit but misses your target by a few pips before reversing to stop you out at breakeven, you did not lose any capital.
However, the firm's system recorded the 3% floating profit as your new high-water mark. Your maximum drawdown limit trails up behind that peak and locks in place. By aiming for massive, distant liquidity pools, you leave your floating equity exposed to deep retracements, which can easily trigger a trailing drawdown breach even if the account balance itself hasn't dropped significantly.
Over-Trading and Analysis Paralysis Because the chart constantly prints Fair Value Gaps and sweeps micro-liquidity levels on the 1-minute timeframe, traders often suffer from narrative trapping (seeing a valid setup in every minor price move, even outside a real killzone). They start seeing setups everywhere, leading to over-trading. In a funded account environment where consistency rules and daily loss limits penalize high trade frequency, forcing setups on minor, insignificant timeframe shifts is a rapid path to a blown evaluation. Because prop firm accounts are typically leveraged, your position size and the account's margin requirements also determine how much room you have before a margin call or stop-out level is triggered, independent of the daily loss limit.
Conclusion
The ICT trading strategy offers a highly mechanical, time-and-price-based approach to the markets. By focusing on liquidity sweeps, displacement, and Fair Value Gaps during specific killzones, traders can build a systematic rulebook that ignores retail noise.
However, mastering the technical execution is only half the battle for a funded trader. The tight stop-losses and lower win rates inherent to the system are in direct conflict with the daily loss limits and trailing drawdown rules of prop firm evaluations. To survive, you must drastically reduce your risk per trade and accept that sitting on your hands during low-probability sessions is the only way to protect your account. The next step is mastering how these concepts fit into a broader view of market structure trading.
Disclaimer: This guide was written with AI assistance, reviewed for accuracy by the Proptary editorial team, and kept up to date. It's for education only — not financial advice. Prop trading and the financial markets carry a significant risk of loss, so consider your own situation and consult a licensed advisor before you trade.
FAQ
What is the win rate of an ICT strategy?
A properly executed ICT strategy tends to have a lower win rate, consistent with its high reward-to-risk design. Because the strategy targets high reward-to-risk ratios (like 1:3 or 1:5), a lower win rate is mathematically normal, though it requires strict risk management to survive consecutive losses.
What does ICT stand for in trading?
ICT stands for Inner Circle Trader, which is the online alias of Michael J. Huddleston, the creator of this specific price-action methodology. The framework focuses on institutional liquidity and market structure rather than standard retail indicators.
What is the difference between ICT and SMC?
Smart Money Concepts (SMC) is largely a simplified, retail-adapted derivative of the broader ICT methodology. While SMC uses similar terminology like order blocks and liquidity sweeps, ICT encompasses a much wider and stricter time-and-price framework.
Can you use an ICT strategy to pass a prop firm challenge?
Yes, many traders use the ICT strategy to pass prop firm evaluations. However, you must carefully adjust your position sizing, as the frequent stop-outs and tight invalidation levels inherent to the strategy can easily trigger a firm's maximum daily drawdown rule.
What time frames are best for the ICT 2022 model?
The ICT 2022 entry model typically relies on higher timeframes (like the 15-minute or 1-hour chart) to identify broad liquidity pools, and lower timeframes (like the 1-minute to 5-minute charts) to execute the market structure shift and fair value gap entry.
Disclaimer
This guide was written with AI assistance, reviewed for accuracy by the Proptary editorial team, and kept up to date. It’s for education only, not financial advice. Prop trading and the derivatives markets carry a significant risk of loss, and past performance is not a guarantee of future results. Consider your own situation and consult a licensed advisor before you trade.
Proptary editorial team independently reviews prop trading firms, verifies payouts, and explains the rules that decide who keeps an account. We disclose affiliate relationships and publish methodology for every score.