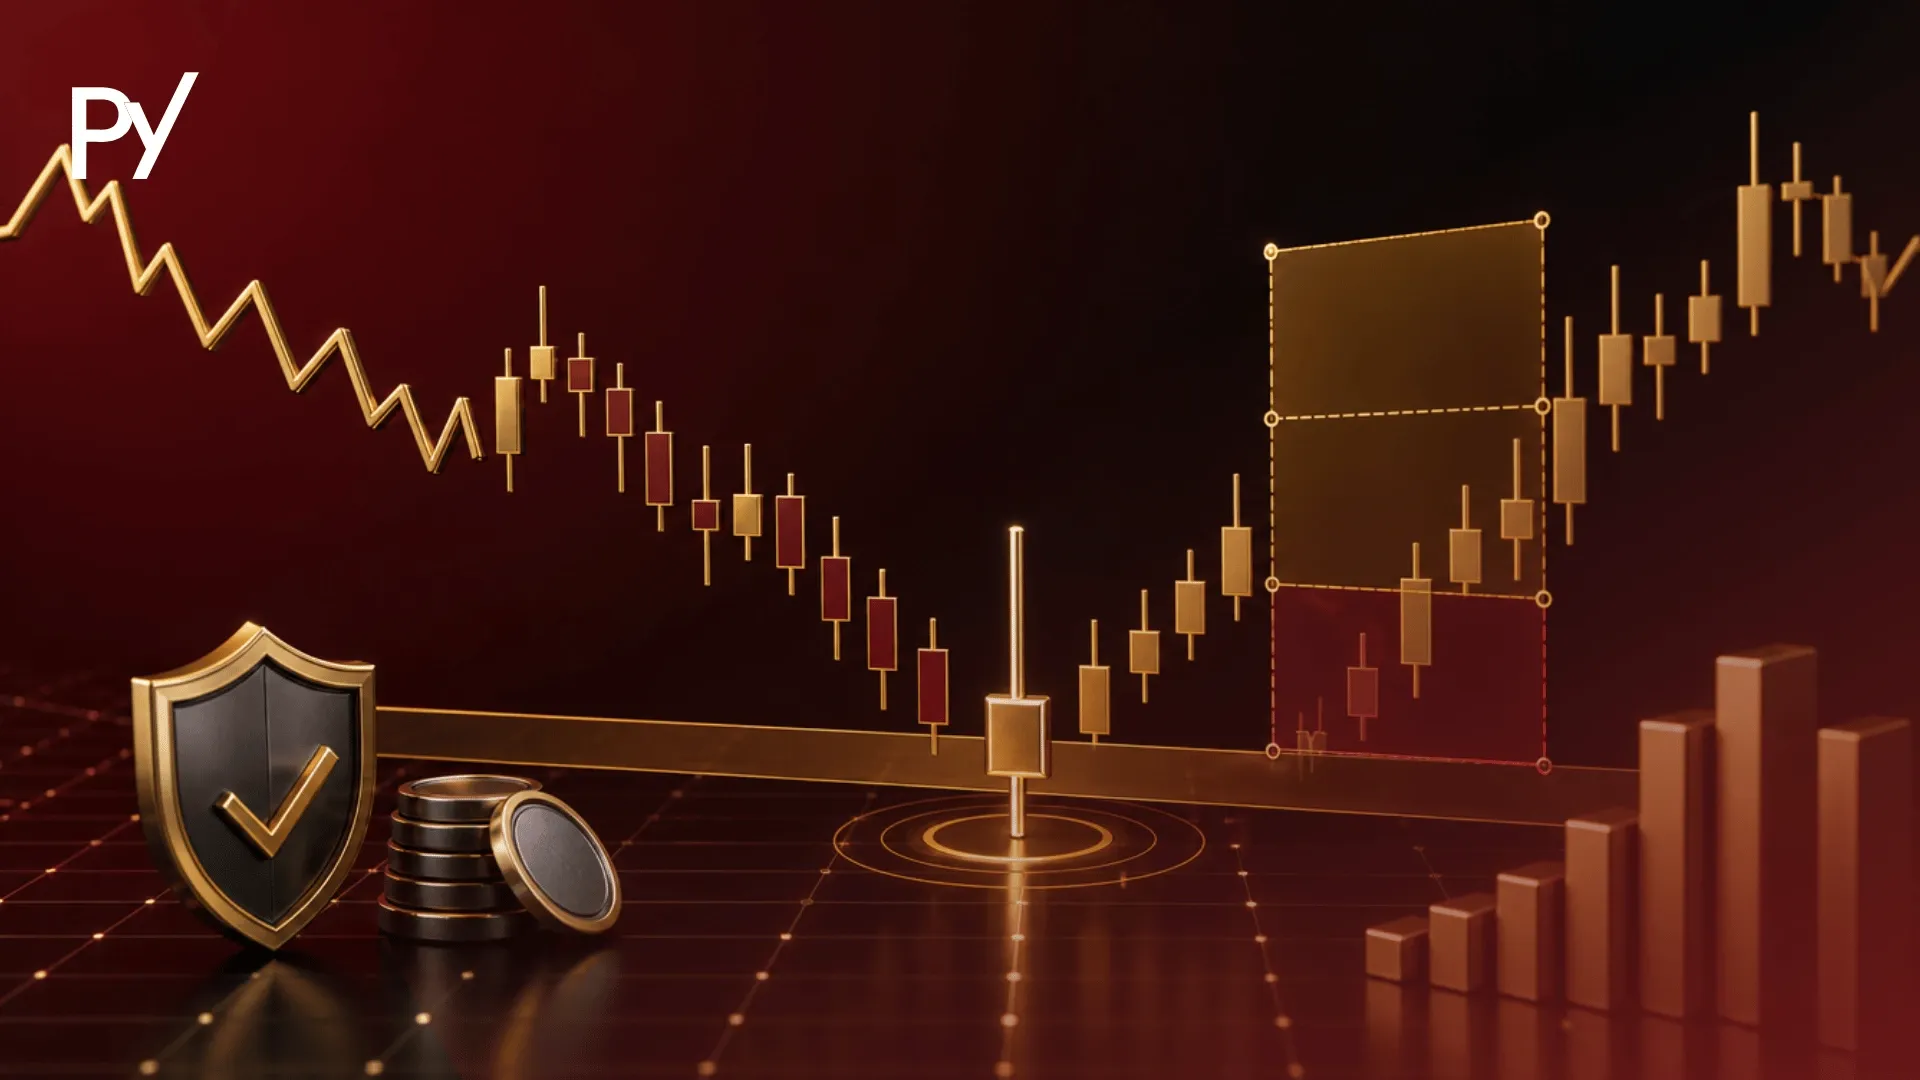
A marubozu candlestick pattern is a single-bar formation with zero or negligible wicks, where the open and close equal the session's high and low. It signifies total directional control by buyers or sellers throughout the session. In prop trading, this pattern signals strong institutional order flow, requiring adjusted position sizing to prevent drawdown breaches on wide stop losses.
A Marubozu candlestick pattern is a single-bar price formation with zero or negligible wicks, where the candle's open and close equal its absolute high and low, signaling absolute directional dominance by buyers or sellers.
When a large momentum candle sweeps across your chart, the urge to chase the move is strong. For funded traders, however, blindly jumping into a Marubozu often results in wide stop-loss placement, oversized risk exposure, and instant account breaches during routine pullbacks.
This guide covers how Marubozu patterns work, how to handle expanded volatility safely, and how to execute momentum setups without violating strict daily drawdown limits.
What Is a Marubozu Candlestick Pattern?
A Marubozu candlestick pattern is a single-candle price action formation characterized by a long, full real body with virtually no upper or lower wicks (shadows). The term "Marubozu" originates from the Japanese word for "shaved" or "bald," referencing the complete absence of wicks at the candle's extremes.
In technical price action analysis, a Marubozu represents total market balance disruption. Price opens at one extreme of the session and moves relentlessly in a single direction to close at the opposite extreme.
Unlike indecision indicators like the doji candlestick pattern, which displays long wicks and a paper-thin real body reflecting buyer-seller equilibrium, a Marubozu demonstrates aggressive, one-sided institutional order flow.
When a Marubozu forms on a price chart, it indicates that one side of the market dominated every tick of the session. Buyers or sellers took control at the open and held that control continuously until the candle closed, leaving no footprint of counter-trend price exploration.
Types of Marubozu Candles: Full, Open, and Close
Marubozu candles are categorized into three distinct structural variations — Full, Open, and Close — based on the presence and placement of minor wicks.
Marubozu Type
Upper Wick
Lower Wick
Market Conviction Level
Marubozu Full
None (shaved)
None (shaved)
Maximum — total dominance from open to close
Marubozu Open
Small (on close end)
None (on open end)
High — strong start, minor pushback before close
Marubozu Close
None (on close end)
Small (on open end)
High — initial pushback, aggressive trend close
Marubozu Full
A Marubozu Full is the purest form of the pattern, featuring zero wicks on either end. On a bullish candle, the Open equals the Low, and the Close equals the High. On a bearish candle, the Open equals the High, and the Close equals the Low. It signifies unbroken control from the first tick to the final second of the timeframe.
Marubozu Open
A Marubozu Open has no wick at its opening price point, but carries a small wick at its closing point. For a bullish Marubozu Open, price opens directly at the session low and rallies aggressively, but experiences slight profit-taking or counter-selling just before the session closes, creating a tiny upper shadow.
Marubozu Close
A Marubozu Close features a small wick at the opening price point, but closes strictly at its extreme high or low without a closing wick. For a bullish Marubozu Close, sellers briefly push price slightly below the open before buyers step in with heavy volume, driving price up to close precisely at the session high.
Bullish vs. Bearish Marubozu Mechanics
Bullish and bearish Marubozu patterns reflect opposing forces of heavy institutional buying.
Bullish Marubozu Mechanics
A Bullish Marubozu opens at its low and closes at its high. It visually represents aggressive demand sweeping available supply across order books. As market orders clear out resting limit sell orders, price expands rapidly upward without pulling back.
This structure frequently appears during high-volume breakout events, trend continuation phases, or violent short squeezes where short sellers are forced to buy back positions into illiquid order books.
Bearish Marubozu Mechanics
A Bearish Marubozu opens at its high and closes at its low. It reflects aggressive institutional selling, liquidations, or heavy short positioning that consumes all resting buy orders.
When a Bearish Marubozu develops, price experiences no upward bounce during the session. It signifies panic selling, institutional distribution, or systemic risk-off sentiment sweeping through the asset class.
Why Marubozu Patterns Matter for Prop Traders
For traders developing essential trading skills for funded traders, the Marubozu pattern serves as a visual indicator of institutional liquidity expansion and directional momentum.
Prop firm evaluations and funded accounts require traders to operate under strict equity constraints, such as maximum daily loss limits and trailing drawdown caps. Recognizing a Marubozu candle allows prop traders to identify key market conditions quickly:
Breakout Validation: A Marubozu closing outside a multi-day consolidation range confirms that institutional capital has committed to the breakout, reducing the likelihood of a false move.
Order Flow Alignment: It signals high-volume market orders, showing funded traders which direction offers the path of least resistance.
Volatility Shifts: The sudden appearance of an expanded Marubozu candle indicates a shift from low-volatility compression to high-volatility expansion, alerting traders to adjust position sizing.
The Extended Stop-Loss Trap: Managing Prop Firm Drawdown Risks
The primary danger of trading a Marubozu candle lies in its large physical body size, which severely distorts traditional stop-loss placement and risk parameters.
Textbook technical analysis suggests placing a stop-loss directly beyond the opposite extreme of the Marubozu candle. If a bullish Marubozu expands across 80 pips on a 1-hour FX chart, placing a stop below its low forces an 80-pip risk distance.
Standard Candle Stop Distance: 15–20 pips → normal lot size.
If you maintain standard lot sizing on an unusually large candle, a single adverse move can cause catastrophic damage. Under standard prop firm rules featuring a 3% to 5% daily drawdown limit, a standard pullback on a wide-stop trade can breach daily loss thresholds before your trade idea has room to play out.
When a large momentum candle closes near major economic news releases, avoid market orders on the close. The sudden spread expansion and subsequent liquidity rebalancing can trigger an account's maximum daily loss limit on a single minor pullback.
Furthermore, Marubozu candles often form during high-impact news events. Entering on these candles subjects traders to severe execution slippage, wider spreads, and potential news-trading rule violations established by prop evaluation providers.
How to Trade the Marubozu Pattern on a Funded Account
Trading a Marubozu candle inside a funded account requires structured execution models designed to minimize equity drawdown while capturing momentum.
Entry Method 1: The Immediate Candle-Close Entry
This aggressive approach involves entering a market or limit order immediately upon the close of the Marubozu candle.
Execution: Buy at the market close of a bullish Marubozu (or sell at the close of a bearish Marubozu).
Risk Management: Because the stop-loss distance to the opposite end of the candle is wide, you must recalculate and reduce your lot size so total risk remains strictly within 0.5% to 1% of your account balance.
Best Used: When the Marubozu breaks out of a long-term range on high relative volume and market momentum is extreme.
Entry Method 2: The 50% Body Retracement Entry (Recommended)
The conservative approach waits for price to pull back into the real body of the Marubozu candle before entering.
Execution: Place a limit order at the 50% Fibonacci midpoint of the Marubozu candle body.
Risk Management: Set the stop-loss slightly beyond the open of the Marubozu candle (or behind key technical structure).
Advantage: Waiting for a 50% retracement cuts stop-loss distance in half, doubling your potential risk-to-reward (R:R) ratio while protecting your daily drawdown buffer against sharp market retracements.
Reversal vs. Exhaustion: How to Avoid Buying the Climax
A Marubozu candle does not guarantee trend continuation; when it appears at the end of an extended move, it frequently signals buyer or seller exhaustion.
To distinguish between momentum continuation and climax exhaustion, evaluate where the Marubozu forms relative to market structure:
Continuation Marubozu: Forms near the beginning or middle of a trend, breaking cleanly out of chart patterns or key moving averages. Volume expands as price moves into open chart space.
Exhaustion Marubozu (Buying/Selling Climax): Forms after a prolonged, multi-leg trend, driving directly into higher-timeframe supply or demand zones. This candle represents retail FOMO traders buying into the high, allowing institutional traders to unload large positions into late liquidity.
If a large bullish Marubozu closes directly into major weekly resistance, entering a long trade carries a high probability of mean-reversion. Funded traders must wait for structural confirmation — such as a higher-timeframe close above resistance — rather than buying into an extended expansion candle.
Always check higher-timeframe key resistance before buying a bullish Marubozu candle. A large momentum candle forming directly against a weekly supply zone often represents institutional traders (sometimes called 'smart money') offloading positions into retail buy-stops, not a clean breakout.
Common Marubozu Trading Pitfalls
Prop traders frequently breach risk parameters when trading Marubozu patterns due to execution mistakes and emotional chasing.
Chasing Extended Moves (FOMO, or fear of missing out): Entering market orders at the very end of a large expansion candle out of fear of missing the move, buying the exact top or selling the exact bottom.
Ignoring Context: Treating every Marubozu as an isolated buy or sell signal without analyzing surrounding market structure, trend direction, or key support/resistance boundaries.
Static Position Sizing: Failing to adjust lot sizes when candle body sizes double or triple, causing accidental max-drawdown breaches on routine stop-outs.
Neglecting News Spread Widening: Placing orders directly into news-induced Marubozu candles where spread expansion distorts execution prices and stop placement.
Identifying Institutional Dominance
The Marubozu candlestick pattern provides a visual signal of institutional dominance, but its trading value depends entirely on execution context. For funded traders working within daily drawdown limits, pattern recognition is only the first step.
Protecting account capital requires managing wide stop-loss distances, adjusting position sizing for volatility, and avoiding exhaustion climaxes at major structural boundaries. Utilizing pullback entries like the 50% body midpoint helps preserve equity while maintaining high-probability exposure to strong market trends.
FAQ
Is a Marubozu candlestick pattern bullish or bearish?
A Marubozu candlestick pattern can be either bullish or bearish, depending on the candle's color and closing direction. A bullish Marubozu opens at its low and closes at its high, indicating complete buyer control. Conversely, a bearish Marubozu opens at its high and closes at its low, signaling persistent seller dominance throughout the session.
What is the main difference between Marubozu Full, Marubozu Open, and Marubozu Close?
The distinction comes down to where minor wicks appear. A Marubozu Full has no wicks on either end, demonstrating unbroken momentum. A Marubozu Open features a small wick on its closing side due to slight late-session pushback. A Marubozu Close has a small wick on its opening side but closes strictly at its extreme price point.
Where should you place a stop-loss when trading a Marubozu candle?
Standard technical rules place the stop-loss beyond the opposite extreme of the Marubozu candle body. However, because Marubozu candles are often large, placing stops at the extreme creates wide risk parameters. Funded traders frequently place stops near the 50% midpoint of the candle body or behind nearby structural support and resistance levels to keep risk tight.
Can a Marubozu candlestick signal a trend reversal instead of continuation?
Yes, a Marubozu candle can act as an exhaustion climax rather than a continuation signal when it appears after an extended trend. If a large Marubozu expands directly into a major higher-timeframe support or resistance zone, it often represents retail traders chasing late momentum while institutional traders unload positions, leading to an immediate price reversal.
How does trading a Marubozu candle impact prop firm daily drawdown limits?
Marubozu candles typically feature unusually wide real bodies, which dramatically increases price distance to standard stop-loss locations. Entering with normal lot sizes on a wide-stop trade exposes funded accounts to severe drawdowns on minor pullbacks. To preserve account limits, prop traders must reduce lot size or wait for a 50% body retracement entry.
Disclaimer
Disclaimer: This guide was written with AI assistance, reviewed for accuracy by the Proptary editorial team, and kept up to date. It's for education only — not financial advice. Prop trading and the financial markets carry a significant risk of loss, so consider your own situation and consult a licensed advisor before you trade.
Proptary editorial team independently reviews prop trading firms, verifies payouts, and explains the rules that decide who keeps an account. We disclose affiliate relationships and publish methodology for every score.