A momentum indicator is a technical oscillator that measures the velocity and rate of change of price movements over a set period. By comparing current closing prices to historical baselines, it helps traders determine trend strength, spot acceleration, and identify market exhaustion. Rather than predicting price direction, momentum tools reveal whether buying or selling pressure is expanding or decaying.
A momentum indicator is a technical analysis tool that measures the velocity, speed, and rate of change of price movements over a specified timeframe.
When trading inside a funded evaluation account, entering late into extended price swings often triggers severe equity retracements. Momentum tools help you gauge whether a market breakout carries genuine directional strength or is suffering from velocity decay before you commit capital under strict daily loss limits.
What Is a Momentum Indicator?
These tools quantify how fast an asset's price is moving by comparing current closing prices to historical baseline prices over a set lookback period. Rather than predicting where the market will travel next, momentum tools reveal the underlying acceleration driving current price action.
The baseline calculation for most velocity tools originates from the Rate of Change (ROC) formula. The mathematical representation compares the current closing price to the closing price N periods ago:
ROC = ((Current Price − Price N Periods Ago) ÷ Price N Periods Ago) × 100
Technical momentum tools fall into two distinct structural categories:
Bounded Oscillators: Operating within a fixed numerical scale (typically 0 to 100), bounded indicators like the Relative Strength Index (RSI) and Stochastic Oscillator highlight statistical extremes. They help traders identify potential overbought or oversold conditions during rangebound market phases.
Unbounded Oscillators: Tools like Moving Average Convergence Divergence (MACD), Commodity Channel Index (CCI), and raw ROC indicators do not feature artificial upper or lower ceilings. They measure raw velocity expansion, making them effective for gauging strong trend acceleration.
A common question among day traders is whether these tools function as a leading or lagging tool. Because momentum calculations rely entirely on historical closing prices, the indicator mathematically lags behind real-time price tick data.
However, because rate-of-change velocity frequently slows down before price physically reverses structure, momentum tools offer an early signal of trend exhaustion.
Acting as a reliable forex velocity gauge across currency pairs and index futures, velocity analysis reveals whether big moves are backed by institutional order flow or hollow volume.
How Momentum Indicators Work: Key Signals and Interpretations
Momentum indicators generate primary actionable trading signals through centerline crossovers, extreme boundary readings, and structural price divergence.
1. Centerline and Zero-Line Crossovers
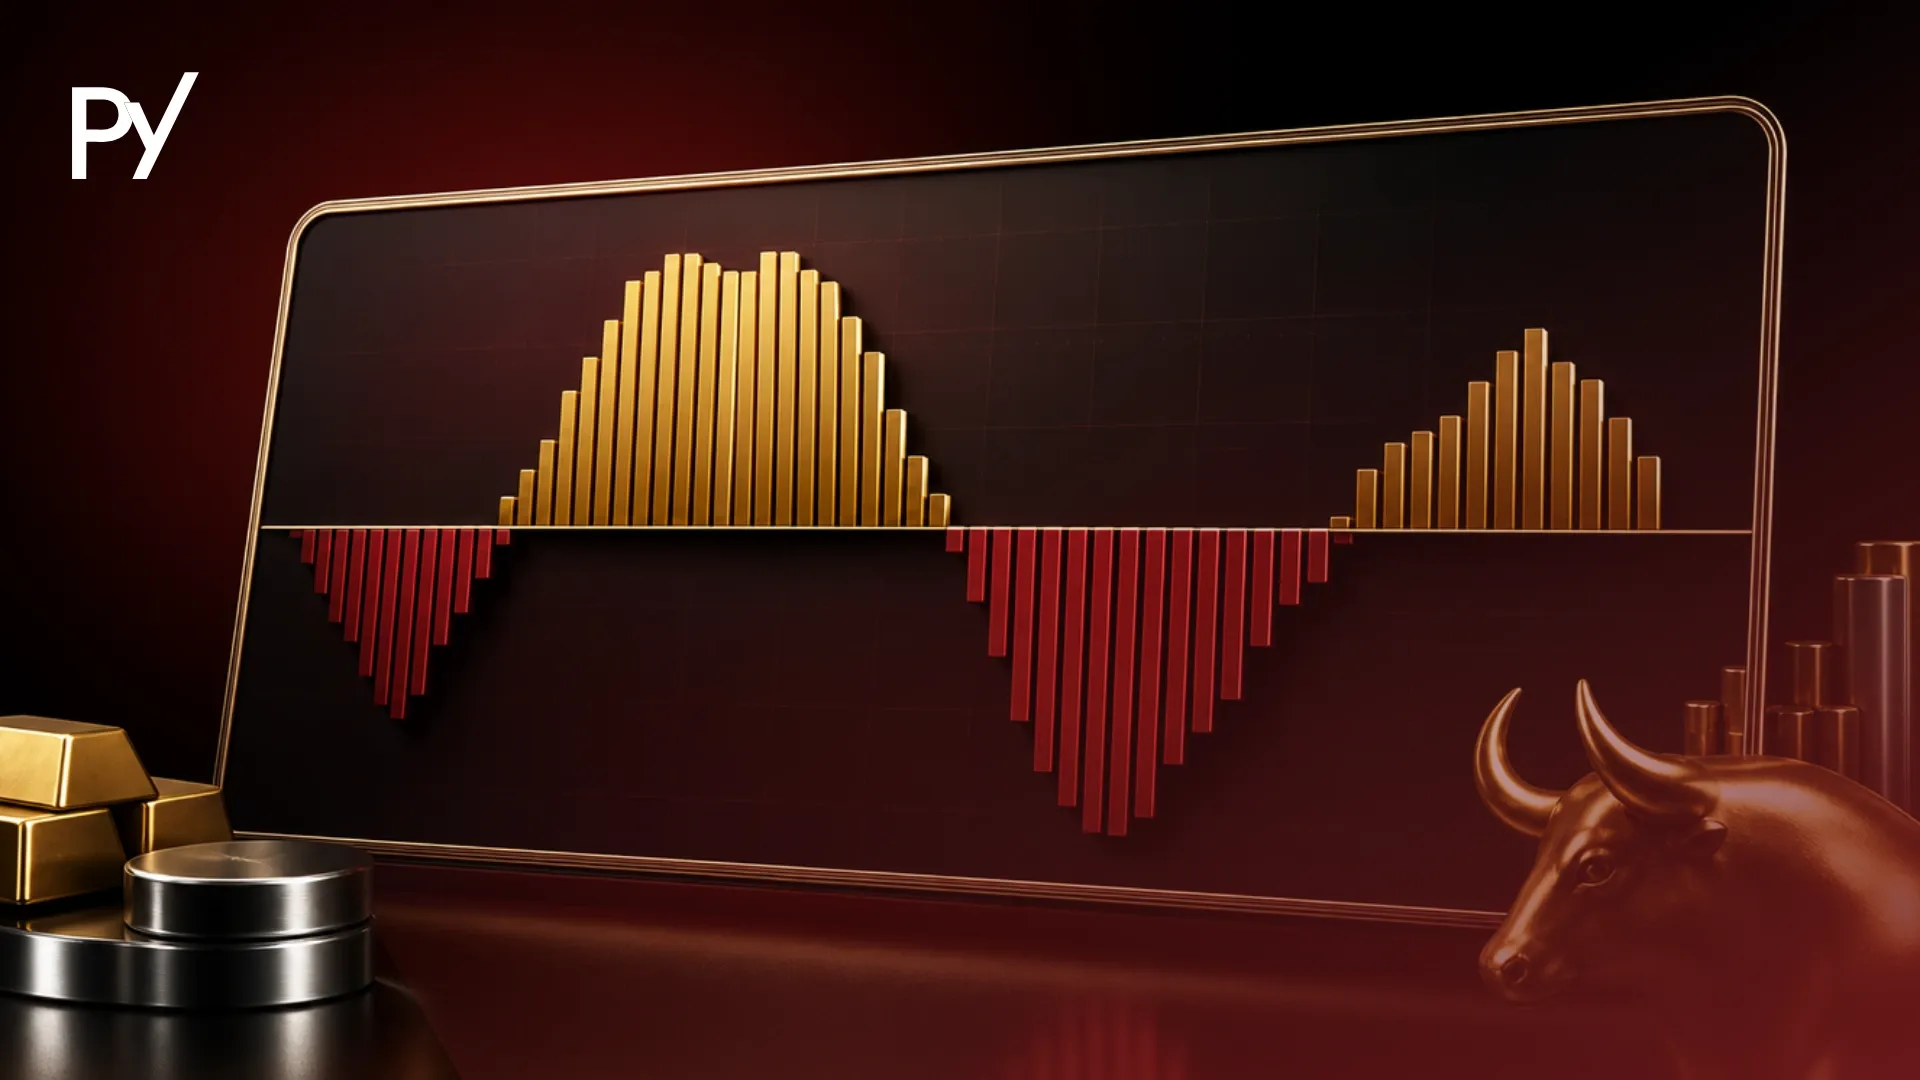
Unbounded indicators fluctuate around a central zero-line, while 0–100 bounded oscillators utilize a 50-level median line. When the indicator line crosses above the zero-line or 50 median, it signals that buyers are driving price expansion at a faster rate than historical averages. Conversely, a cross below the centerline confirms that downside momentum is accelerating.
2. Overbought and Oversold Boundaries
Bounded indicators define upper thresholds (typically 70 or 80) as overbought and lower thresholds (30 or 20) as oversold. In a rangebound environment, price hitting these extremes suggests that buying or selling pressure has reached statistical limits, making a mean-reversion move likely.
However, interpreting these boundaries requires market context. In a powerful trending market, an indicator can remain pinned in overbought territory for extended periods while price continues to push aggressively higher.
3. Bullish and Bearish Divergence
Divergence occurs when price action and momentum slope move in opposite directions, signaling a mismatch between price location and underlying velocity:
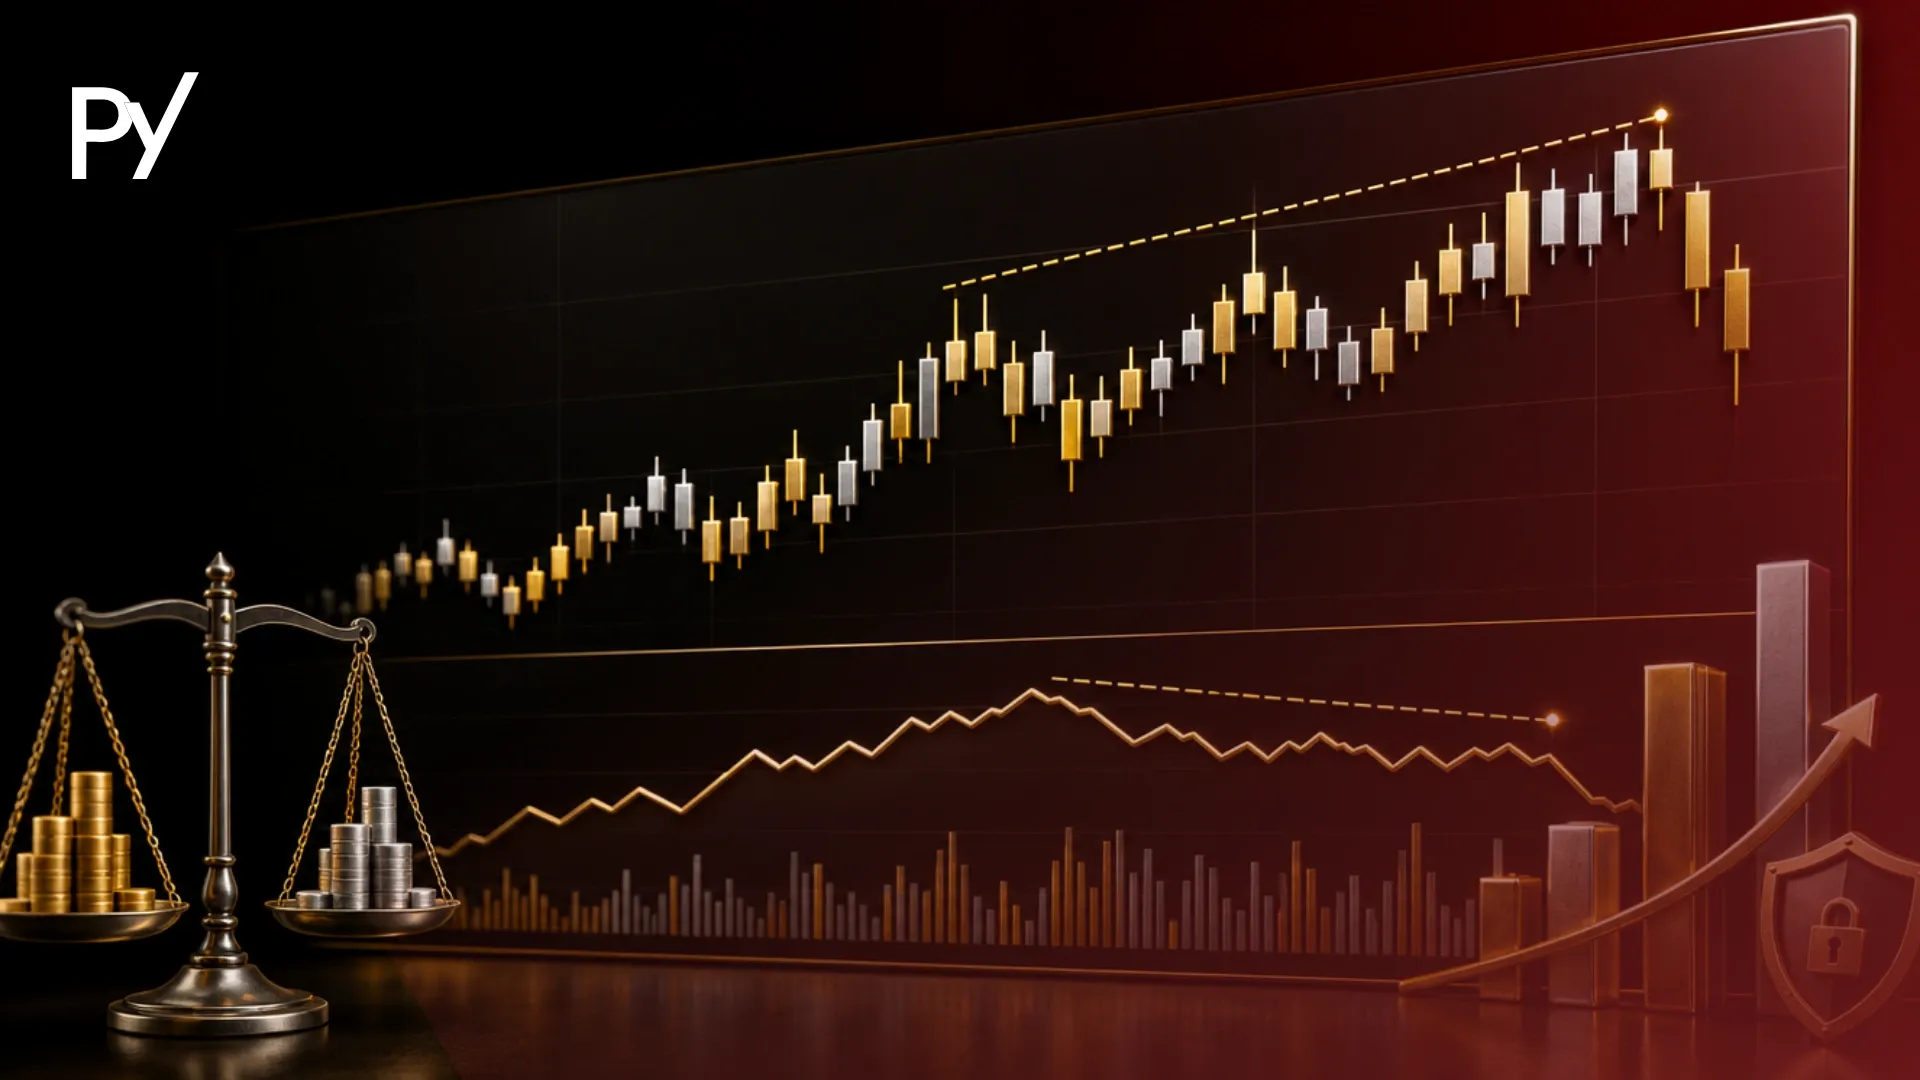
Regular Bearish Divergence: Price prints a higher high, but the momentum indicator prints a lower high. This indicates that despite higher prices, buying velocity is decaying — a precursor to trend exhaustion.
Regular Bullish Divergence: Price prints a lower low, but the momentum indicator prints a higher low. Downside selling acceleration is weakening, signaling an impending upward retracement or reversal.
Hidden Divergence: Occurs when price prints a higher low while momentum prints a lower low (bullish hidden), signaling trend continuation rather than reversal.
Evaluating the Best Momentum Indicators for Forex and Multi-Asset Trading
Choosing the best momentum indicator for your trading platform depends on whether your strategy requires bounded range boundaries, trend acceleration filters, or unbounded cyclical tracking.
Relative Strength Index (RSI)
Developed by J. Welles Wilder, RSI evaluates the ratio of recent upward price changes to downward price changes over a 14-period default window. It is widely considered the standard tool for identifying momentum divergence and overextended trend legs in major currency pairs.
Moving Average Convergence Divergence (MACD)
MACD combines momentum tracking with trend-following mechanics by subtracting a 26-period Exponential Moving Average (EMA) from a 12-period EMA. The resulting MACD line and histogram excel at confirming trend momentum shifts when crossing the signal line or zero boundary.
Stochastic Oscillator
The Stochastic Oscillator compares an asset's closing price to its price range over a specified period (typically 14 periods). Because it is highly sensitive to short-term price swings, intraday scalpers utilize Stochastic crossovers to time precise entries during rangebound sessions.
Commodity Channel Index (CCI)
The CCI indicator is an unbounded oscillator that measures an asset's current price deviation from its statistical moving average. By fluctuating around a zero base with key boundaries at +100 and −100, CCI helps traders identify emerging cyclical momentum and fast-moving breakout conditions.
Indicator
Best Asset Class & Timeframe
Primary Signal Type
Trailing Drawdown Risk Profile
Relative Strength Index (RSI)
Forex & indices (15m – 4h)
Divergence & exhaustion
High risk if taking unconfirmed counter-trend trades in extreme zones
MACD
Forex, commodities, futures (1h – daily)
Zero-line & signal line crossovers
Low risk when applied as a multi-timeframe velocity filter
Stochastic Oscillator
Forex ranges & intraday scalping (1m – 15m)
Overbought/oversold crossovers
High risk in strong trend expansions due to premature reversal signals
Commodity Channel Index (CCI)
Multi-asset cyclical trends (15m – 1h)
Extreme deviation crossovers (+100/−100)
Moderate risk; requires price structure confirmation before entry
3 Ways Funded Traders Use Market Momentum Indicators
Funded traders use a market momentum indicator as an objective risk filter to validate entry velocity, manage position size, and avoid emotional execution errors inside evaluation accounts.
1. Filtering Low-Volume Breakouts
Fakeouts represent one of the primary causes of evaluation account failures. When price breaks out above key horizontal resistance, traders check momentum slope. If price pushes higher but the momentum indicator remains flat or sloping downward, the move lacks institutional velocity. Funded traders pass on these setups, avoiding low-liquidity traps.
2. Timing Risk Reduction via Divergence
When managing an open trade in a multi-leg trend move, regular divergence warns that momentum is fading. Rather than waiting for price to reverse into a stop-loss, funded traders use divergence cues to scale out of positions, lock in partial profits, or move trailing stop-losses tighter. This proactive risk adjustment protects accrued equity from trailing drawdown rules.
3. Avoiding Late-Stage Entries (Mitigating FOMO)
Fear of missing out (FOMO) causes traders to chase extended candle surges near major support or resistance pools. By requiring that momentum readings sit below overbought thresholds prior to opening long positions, traders enforce execution discipline and prevent buying at market tops.
When trading evaluation accounts with tight trailing drawdowns, never use a momentum indicator as an isolated entry trigger. Always pair momentum exhaustion signals with market structure shifts — such as a broken swing low — before taking counter-trend risk.
The Overbought Trap: Why Chasing Reversals Fails Funded Accounts
One of the costliest habits in technical trading is treating overbought momentum signals as immediate short-entry triggers during strong market trends.
When an asset enters a macro trend expansion, bounded indicators like RSI (above 70) or Stochastic (above 80) stay pinned in extreme overbought territory for extended durations. Retail traders frequently scale into counter-trend short positions under the assumption that "what goes up must come down." Meanwhile, institutional order flow continues absorbing liquidity, driving price higher.
In a funded account environment, fighting strong directional momentum rapidly accumulates unrealized drawdown. Because prop firm rules enforce rigid maximum daily loss limits calculated from open equity peaks, this mistake accounts for a significant share of challenge failures.
To eliminate this execution trap, never take counter-trend trades based solely on an indicator reaching an extreme level. Require explicit structural price confirmation — such as a Change of Character (ChoCh) or a broken swing low — before committing risk against prevailing market momentum.
Incorporating Momentum Tools
Understanding how a momentum indicator measures price velocity allows you to evaluate market strength objectively rather than guessing inflection points. By combining rate-of-change metrics with structural price levels, you can filter low-probability breakouts, spot trend decay early, and protect account capital from severe equity swings.
Incorporating momentum tools alongside broader technical indicators strengthens your overall execution framework inside evaluation and funded accounts.
FAQ
What is the difference between a trend indicator and a momentum indicator?
A trend indicator (like a moving average) identifies the primary direction of market trajectory over time, operating with a noticeable lag. In contrast, a momentum indicator measures the velocity and rate of change of price movements. While trend indicators show where price has been, momentum indicators reveal whether current price acceleration is strengthening or losing power.
Is a momentum indicator leading or lagging?
Mathematically, momentum indicators are lagging tools because their calculations depend entirely on past price data. However, because price velocity typically decelerates before market structure physically turns, momentum indicators often function as leading indicators for trend exhaustion, providing traders with an early warning signal before price action reverses direction.
Which momentum indicator is best for intraday forex trading?
The choice depends on market structure. Bounded oscillators like the Stochastic Oscillator and 14-period RSI are highly effective for identifying short-term overbought or oversold conditions during rangebound forex sessions. For tracking sustained breakout momentum across currency pairs, unbounded tools like MACD or CCI provide clearer signals without hitting artificial ceilings.
How do you spot divergence on a momentum indicator?
Divergence occurs when the directional slope of price action conflicts with the indicator's slope. Regular bearish divergence forms when price prints a higher high while the momentum oscillator prints a lower high, signaling weakening buyer velocity. Bullish divergence forms when price makes a lower low while momentum makes a higher low, indicating diminishing seller pressure.
Why do overbought momentum signals fail during strong trends?
Overbought thresholds (such as RSI above 70) measure relative speed, not absolute price caps. During aggressive institutional trend expansions, buying pressure remains elevated, keeping momentum indicators pinned in extreme territory while price continues pushing higher. Shorting solely based on overbought signals in a strong trend frequently results in severe equity drawdowns.
Disclaimer
Disclaimer: This guide was written with AI assistance, reviewed for accuracy by the Proptary editorial team, and kept up to date. It's for education only — not financial advice. Prop trading and the financial markets carry a significant risk of loss, so consider your own situation and consult a licensed advisor before you trade.
Proptary editorial team independently reviews prop trading firms, verifies payouts, and explains the rules that decide who keeps an account. We disclose affiliate relationships and publish methodology for every score.