
John Bollinger's "Bollinger on Bollinger Bands" framework defines relative price level and market volatility using normalized indicators — specifically %b and BandWidth — derived from standard deviation envelopes surrounding a baseline moving average.
This is the practical heart of Bollinger on Bollinger Bands: using %b to time entries and BandWidth to size them. For funded traders, understanding relative price context prevents catastrophic account breaches caused by misinterpreting volatility spikes. When trading under strict daily drawdown rules, static indicators fail because price behavior shifts dramatically between quiet consolidations and dynamic expansions.
This guide breaks down the mathematical mechanics of Bollinger Bands, how to trade band rides versus squeezes, and how to dynamically adjust lot sizing to protect your equity.

Bollinger on Bollinger Bands: How Volatility Mechanics Protect Funded Accounts
On this pageWhat Is John Bollinger's "Bollinger on Bollinger Bands" Framework?
- What Is John Bollinger's "Bollinger on Bollinger Bands" Framework?
- The Mechanics: Standard Deviation, %b, and BandWidth
- Riding the Bands vs. The Volatility Squeeze in Funded Accounts
- Dynamic Position Sizing Rules for Prop Traders
- Common Bollinger Band Traps That Fail Prop Challenges
- Trading Relative Market Volatility
- FAQ
Direct Answer
John Bollinger's framework evaluates asset prices relative to dynamic volatility rather than fixed levels. By using normalized sub-indicators like %b and BandWidth, traders measure price location and volatility compression. In funded account trading, this framework prevents account breaches by scaling position sizes inversely to market expansion.
What Is John Bollinger's "Bollinger on Bollinger Bands" Framework?
John Bollinger's core framework establishes that price level must always be evaluated relative to historical volatility rather than against fixed numerical thresholds. Traditional technical analysis often treats price as an isolated metric — labeling an asset as "cheap" or "expensive" based on static support levels or oscillator readings like RSI hitting 70.
Bollinger proved that a high price or low price is relative; an asset trading at $100 might be cheap during extreme volatility expansion, yet expensive during tight market consolidation.
The primary objective of the framework is to construct dynamic adaptive envelopes around price action. By surrounding a moving baseline with statistical boundaries that expand and contract automatically, traders gain an objective measurement of price volatility.
Rather than predicting directional path directly, the indicator defines market regimes — distinguishing between quiet, low-risk buildup periods and high-velocity trend expansions.
In prop trading environments, static assumptions kill accounts. Evaluation rules test trader discipline through strict capital parameters like maximum daily drawdown and trailing drawdown limits.
Recognizing whether current price action represents normal statistical variance or an aggressive volatility regime is the difference between keeping a funded account and suffering a liquidating rule breach.
The Mechanics: Standard Deviation, %b, and BandWidth
Bollinger Bands consist of a central trend line flanked by upper and lower bands set two standard deviations apart, encapsulating roughly 95.44% of historical price action under a normal Gaussian distribution.The standard default baseline relies on a 20-period Simple Moving Average (SMA). However, technical traders frequently adapt the baseline to an exponential moving average when trading shorter intraday timeframes to reduce lag during sudden news releases.
- Middle Band = 20-period Simple Moving Average (SMA)
- Upper Band = 20-period SMA + (2 × 20-period standard deviation)
- Lower Band = 20-period SMA − (2 × 20-period standard deviation)
Standard deviation calculates variance relative to the mean. When prices fluctuate wildly, standard deviation rises and the envelope expands. When price action compresses into a range, standard deviation drops and the envelope contracts.
To translate these dynamic boundaries into actionable decision metrics, John Bollinger introduced two normalized sub-indicators: %b and BandWidth.
Calculating %b (Percent b)
The %b formula normalizes current price position relative to the upper and lower bands, answering the question: where is price located in relation to its volatility envelope?
%b = (Last Price − Lower Band) ÷ (Upper Band − Lower Band)
- %b > 1.0: Price is trading above the upper band (extreme positive momentum).
- %b = 0.5: Price is sitting exactly on the middle 20-period moving average.
- %b < 0.0: Price is trading below the lower band (extreme negative momentum).
Calculating BandWidth
BandWidth measures the percentage spread between the outer bands, quantifying market volatility directly.
BandWidth = (Upper Band − Lower Band) ÷ Middle Band
When BandWidth reaches multi-period lows, the market is coiled in extreme low volatility (a squeeze). When BandWidth explodes upward, market volatility is expanding rapidly.
| Indicator Metric | Formula / Basis | Primary Trading Signal | Prop Firm Risk Context |
|---|---|---|---|
| Bollinger Bands | 20 SMA ± (2 × SD) | Relative price boundaries & volatility envelope | Defines absolute boundaries for standard price variance |
| %b | (Price − Lower) ÷ (Upper − Lower) | Relative location of price within the bands | Relative location of price within the bands |
| BandWidth | (Upper − Lower) ÷ Middle | Absolute rate of volatility compression/expansion | Triggers dynamic lot-size scaling to control drawdown velocity |
Riding the Bands vs. The Volatility Squeeze in Funded Accounts
The volatility squeeze occurs when standard deviation bands contract to multi-period lows, signaling an imminent surge in price dispersion that can either fund an account or breach its daily loss limit. Volatility is cyclical: periods of low volatility inevitably lead to periods of high volatility, and vice versa.

Navigating the Bollinger Squeeze
When BandWidth compresses to its lowest point in 6 to 12 months, a directional breakout is often brewing, though the timing and direction are not guaranteed. Traders who try to anticipate the direction during the squeeze often get chopped up in head-fakes, incurring minor losses that quickly accumulate against daily drawdown rules.
- Wait for expansion: Never enter inside the tightest point of the squeeze.
- Confirm with %b: Look for a directional candle close outside the band where %b crosses above 1.0 or below 0.0.
- Verify volume/momentum: Ensure secondary momentum confirms the breakout velocity.
Riding (Walking) the Bands
A common failure mode for retail traders is assuming that an upper band touch automatically means the market is "overbought." In strong momentum markets, price will continuously push against or walk along the upper or lower band for multiple consecutive candles. This phenomenon is called "riding the bands."
In a prop evaluation, riding the bands can offer some of the more favorable reward-to-risk setups when the trend holds. Entering in the direction of the band-ride allows you to trail your stop along the 20-period middle band baseline, capturing substantial multi-R wins — where 1R equals your initial risk per trade — that easily hit firm profit targets.
Many traders fail prop evaluations during volatility expansions because they keep lot sizes fixed while BandWidth triples. Sizing trades off fixed pip stop-losses during a squeeze creates massive slippage and drawdown when market expansion begins. Always scale position volume dynamically based on structural market volatility.
Dynamic Position Sizing Rules for Prop Traders
Dynamic position sizing requires scaling your contract volume inversely to changes in Bollinger BandWidth so your total dollar risk stays constant across shifting volatility regimes. Many prop firms set a maximum daily-loss limit somewhere in the 3% to 5% range of account balance, though the exact figure varies by firm and evaluation program — always confirm the specific number in your firm's rulebook.
If your trade sizing relies on a fixed lot size (e.g., always trading 5 lots), a volatility expansion will blow through your drawdown buffer in a fraction of the usual time.
The BandWidth Adjustment Formula
To maintain consistent dollar risk when volatility expands, contract your lot sizing proportionally to the expansion in BandWidth:
Adjusted Lot Size = Baseline Lot Size × (Baseline BandWidth ÷ Current BandWidth)
For example, if your standard risk model uses a 2.0-lot position size during quiet market conditions (BandWidth = 0.0200), and a sudden news announcement causes BandWidth to expand to 0.0600 (tripling market volatility), your trade sizing must contract:
Adjusted Lot Size = 2.0 × (0.0200 ÷ 0.0600) = 0.67 lots
By contracting lot size during high BandWidth regimes, you ensure that wide pip stop-losses (placed outside extended structural bands) equal the exact same maximum dollar risk on your dashboard.
Common Bollinger Band Traps That Fail Prop Challenges
The most dangerous trading trap when using Bollinger Bands is shorting upper band touches during strong market trends, confusing extreme relative price with an imminent mean-reversion reversal. Understanding structural traps preserves your evaluation challenge equity.
Trap 1: The "Overbought Reversal" Fading Trap Traders often view an upper band tag as a sell signal. When an asset enters a strong impulse phase, price tag after tag occurs while %b stays pinned above 1.0. Fading this move under a trailing drawdown regime results in cascading losses, as your capital floor moves up with peak unrealized equity while open trade losses accelerate against your balance limit.
Trap 2: Squeeze Head-Fakes Prior to a true directional expansion, price often breaks slightly out of one side of a squeeze, instantly pulls back inside the envelope, and then violently breaks out in the opposite direction. Entering heavily on the first boundary touch without waiting for a candle close outside the envelope leaves you vulnerable to account-ending slippage.
Trap 3: Static Stop-Losses in Expanding Volatility Placing a static 10-pip stop loss inside an expanding volatility envelope guarantees getting stopped out by noise. In wide BandWidth regimes, market noise alone routinely spans 20 to 30 pips. Stop losses must be derived dynamically from standard deviation levels or structural band boundaries.
Trading Relative Market Volatility
Mastering John Bollinger's framework shifts your focus from guessing price direction to trading relative market volatility. By normalizing price location with %b and tracking structural compression through BandWidth, prop traders can dynamically adapt lot sizing to protect strict daily drawdown limits. Understanding that band touches represent momentum rather than guaranteed reversals keeps you on the correct side of trend expansions.
Building an institutional-grade strategy requires combining dynamic volatility envelopes with broader momentum and structural technical indicators to build a robust, repeatable trading framework.
FAQ
What is the primary concept behind John Bollinger's "Bollinger on Bollinger Bands"?
The primary concept is that price must always be evaluated relative to historical volatility rather than static levels. Instead of viewing an asset as overbought or oversold based on fixed numerical indicators, John Bollinger used standard deviation envelopes to define dynamic price boundaries, allowing traders to adapt their strategy to changing market regimes.
What is the difference between %b and Bollinger BandWidth?
Percent b (%b) measures where current price is located relative to the upper and lower bands on a scale where 0.5 represents the middle moving average. BandWidth measures the absolute percentage spread between the outer bands, quantifying whether market volatility is compressing into a squeeze or rapidly expanding into a trend.
How do you avoid false breakout traps during a Bollinger Squeeze?
To avoid false breakout traps, wait for a candle close outside the envelope rather than entering on an initial boundary touch. Confirm the directional move using %b crossing above 1.0 or below 0.0, and check secondary volume or momentum indicators to verify breakout velocity before placing your trade.
Should prop traders use SMA or EMA for the middle band of Bollinger Bands?
While John Bollinger's original formula uses a 20-period simple moving average (SMA), intraday prop traders often substitute a 20-period exponential moving average (EMA). An EMA reacts faster to recent price spikes, providing earlier warning during sudden volatility shifts and helping protect tight daily drawdown limits.
Is a Bollinger Band touch an automatic signal to enter a counter-trend trade?
No, a band touch is not an automatic reversal signal. In strong trending markets, price can continuously push against or walk along the upper or lower band for multiple candles. Fading these touches often leads to heavy losses; instead, treat band touches as momentum continuation signals during dynamic trend expansions.
Disclaimer
Disclaimer: This guide was written with AI assistance, reviewed for accuracy by the Proptary editorial team, and kept up to date. It's for education only — not financial advice. Prop trading and the financial markets carry a significant risk of loss, so consider your own situation and consult a licensed advisor before you trade.
Firm reviews, rule explainers, payout verification
Proptary editorial team independently reviews prop trading firms, verifies payouts, and explains the rules that decide who keeps an account. We disclose affiliate relationships and publish methodology for every score.
Related articles

How to Use Moving Averages in Funded Trading: Trend Filters and Risk Controls
Learn how to use moving averages to filter trends and protect your daily drawdown limit. Read the full guide.
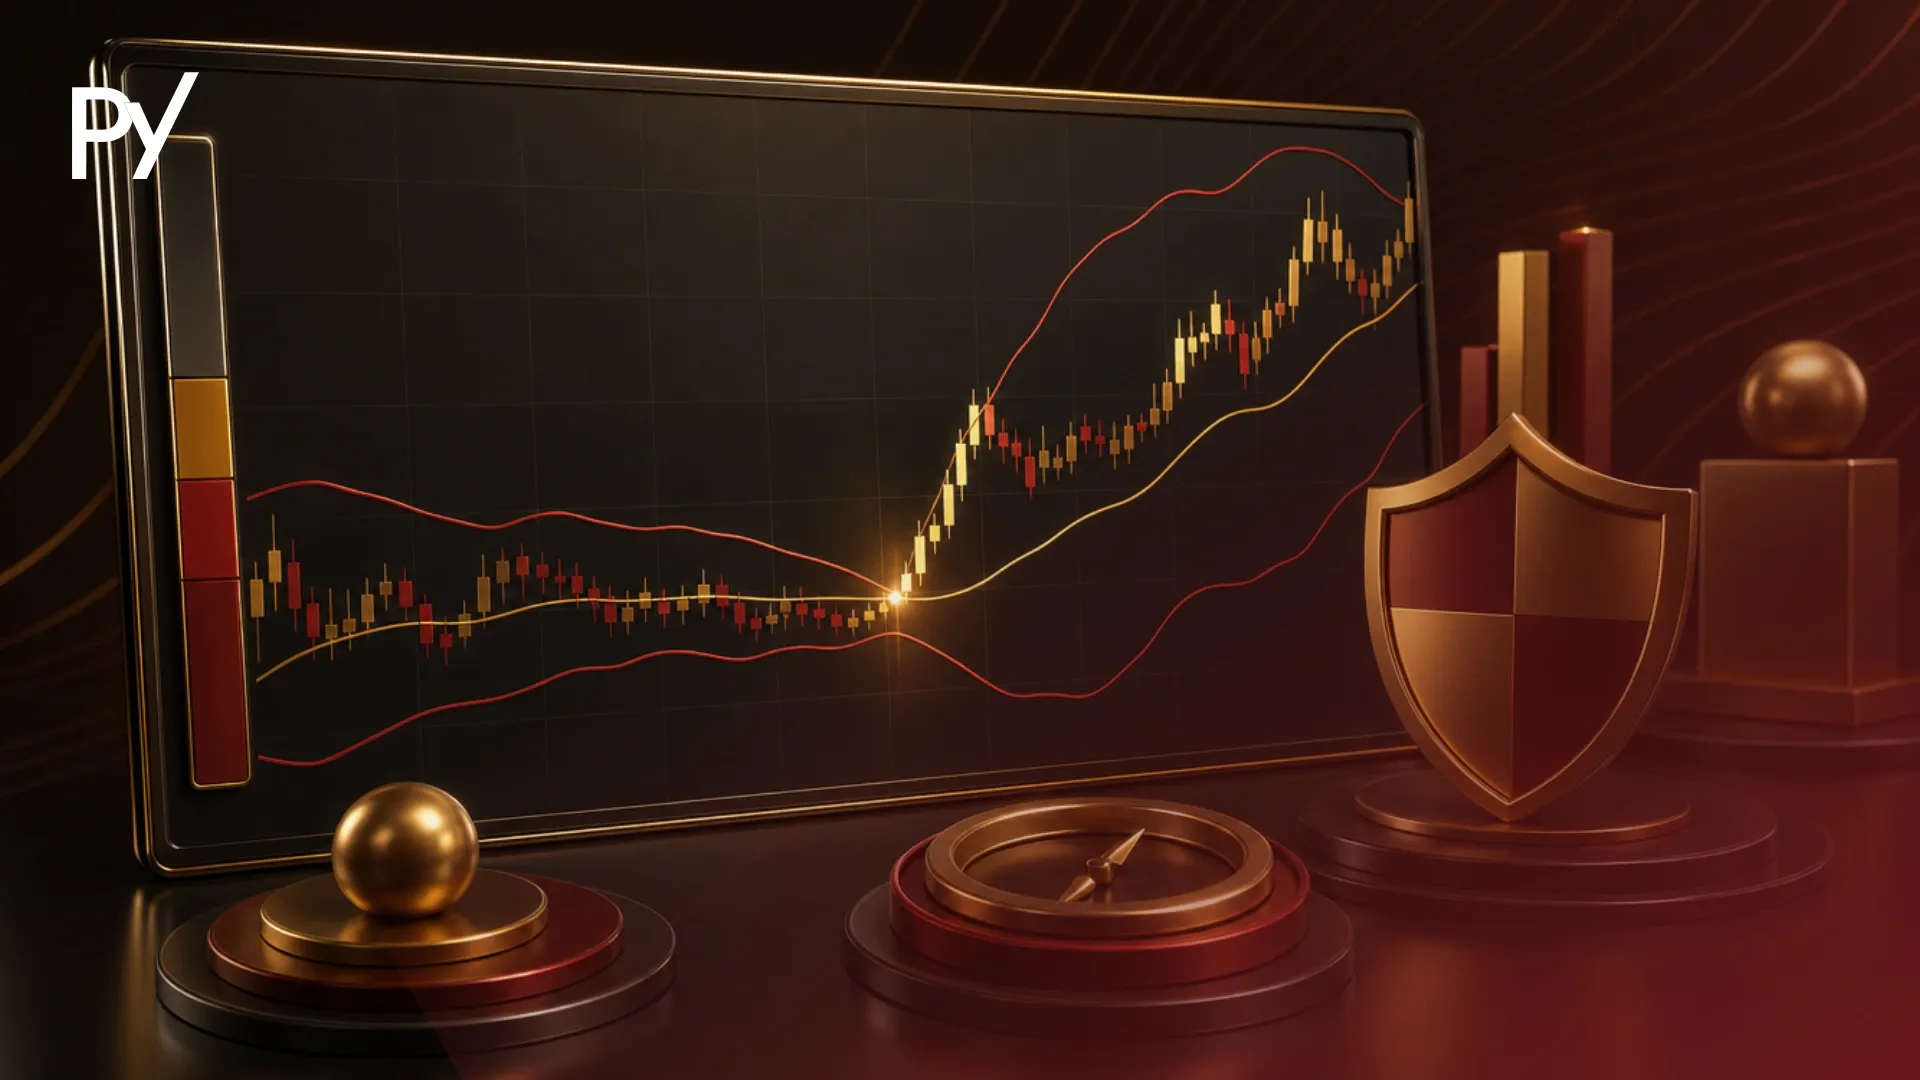
Bollinger Bands Strategy: How to Trade Volatility Without Tripping Prop Rules
Learn how to use a Bollinger Bands strategy to capture breakouts and mean-reversion moves without breaching prop firm drawdown limits. Read the full guide.

Is Swing Trading Profitable for Funded Traders?
Learn if swing trading is profitable under prop firm rules, swap costs, and drawdown limits. Read the full guide.
What Is VWAP and How Do Funded Traders Use It?
Learn how VWAP measures institutional fair value and protects funded accounts from daily drawdown breaches. Read the full guide.

What Is Swing Trading in Forex? A Guide for Funded Traders
Discover what is swing trading in forex, how multi-day holding works, and funded account rules. Read the full guide.

What Is the Exponential Moving Average (EMA)? A Guide for Prop Traders
Learn how the exponential moving average (EMA) cuts lag and tracks trend momentum for prop traders. Read the full guide.