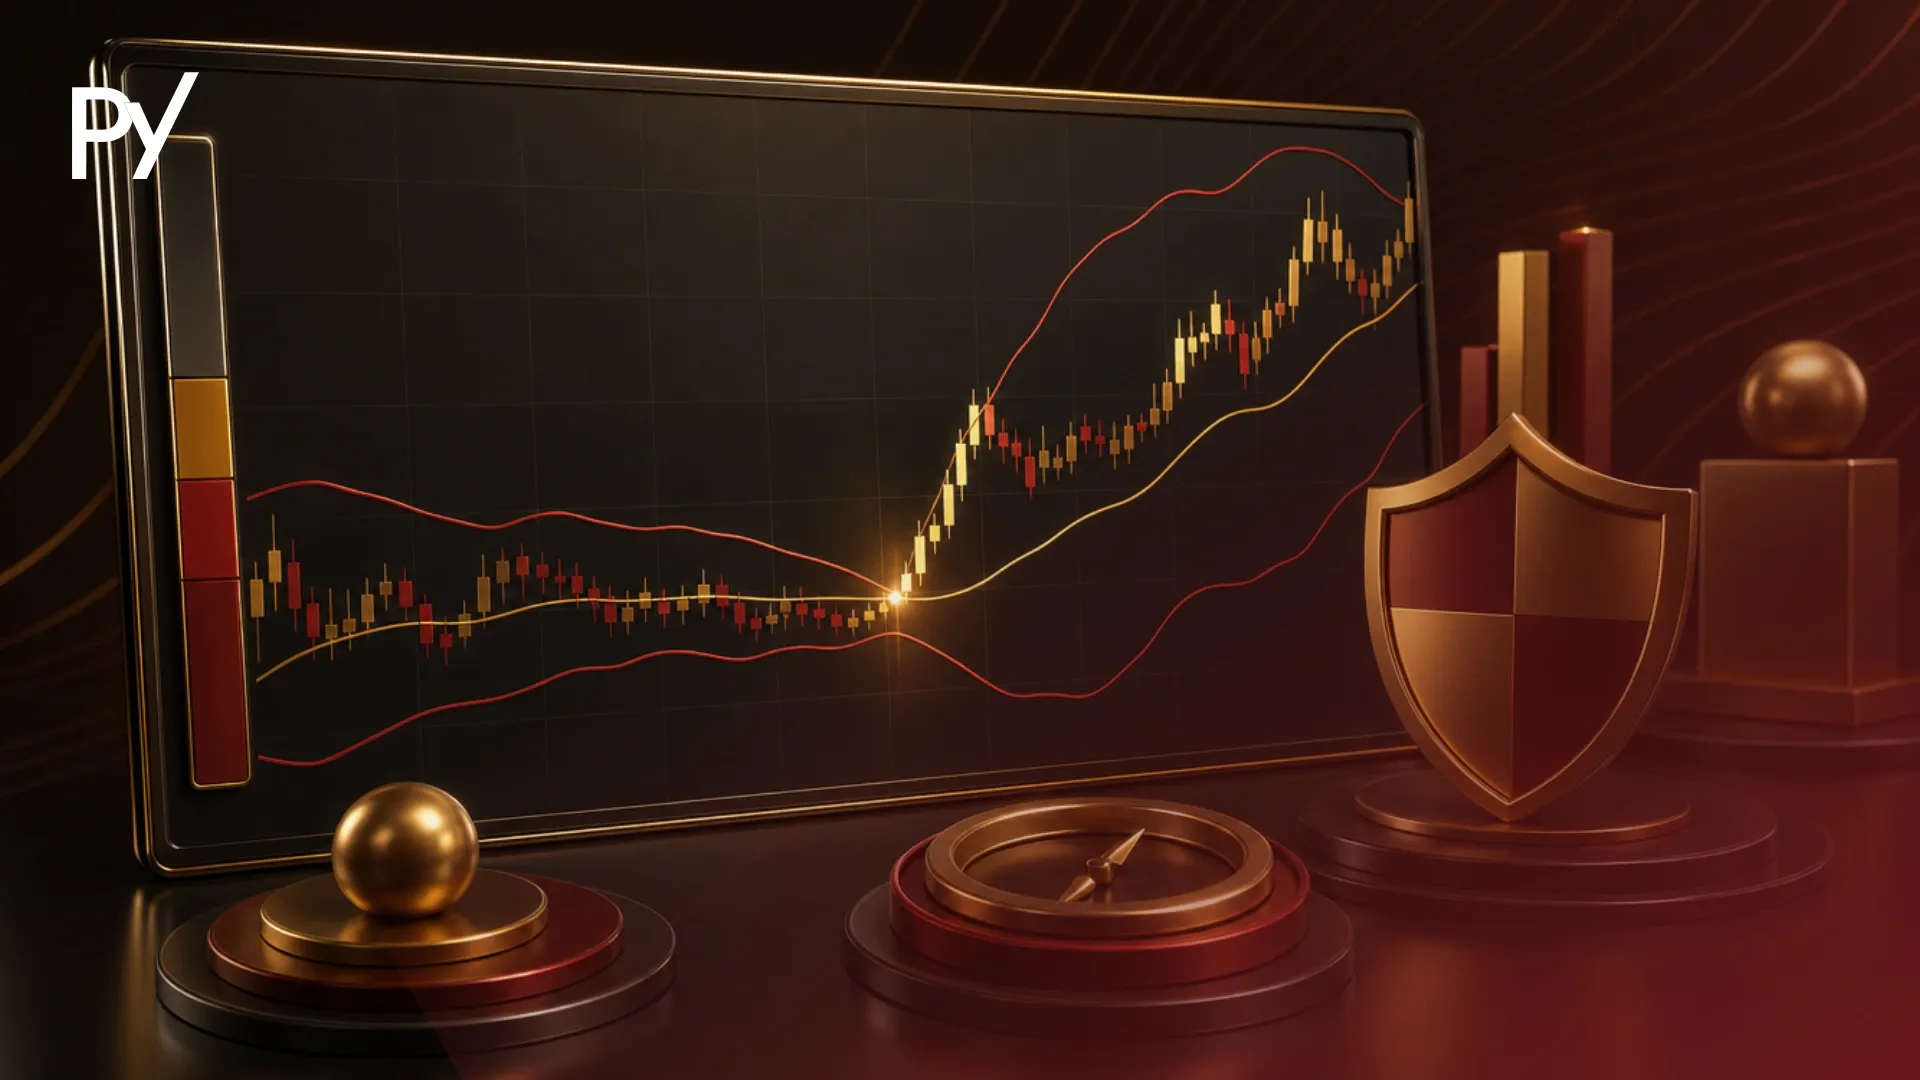
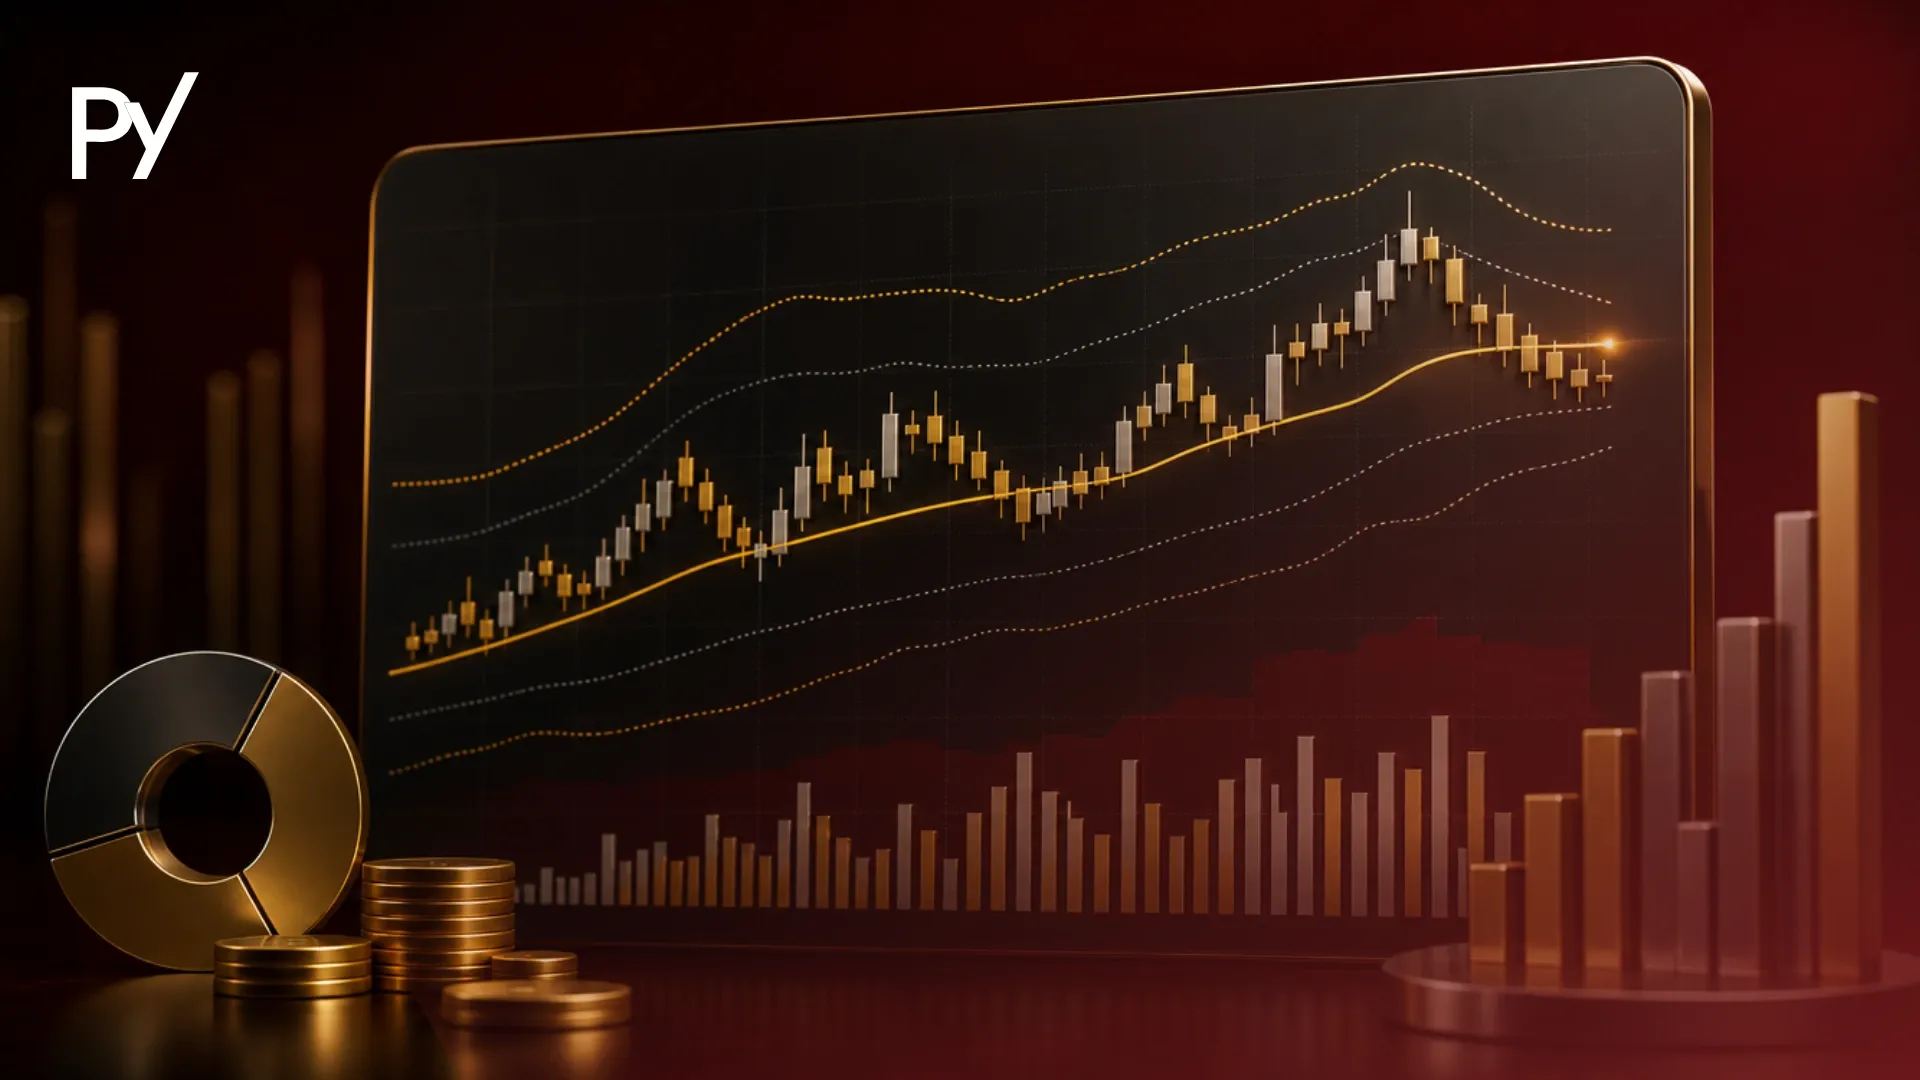
A moving average is a lagging technical indicator that smooths historical price data to establish market trend direction. In funded trading strategies, moving averages are best used as macro trend filters and dynamic support/resistance zones rather than standalone crossover entry signals. Using them to restrict trade direction helps protect account balance from recurring whipsaw losses in choppy markets.
A moving average (MA) is a lagging technical indicator that smooths historical price data over a specified timeframe to identify overall market trend direction.
Retail traders frequently fail evaluation accounts by executing lagging crossover signals inside rangebound consolidation, triggering daily equity drawdown limits before price ever confirms a move.
Utilizing moving averages as macro trend filters and systematic risk boundaries — rather than predictive entry triggers — helps protect your account under strict evaluation parameters. Understanding how to use moving averages correctly is one of the fastest ways to cut down avoidable drawdown in a funded account.
What Is a Moving Average? (SMA vs. EMA Explained)
A moving average is a technical calculation that continuously updates the average price of an asset over a set number of periods to filter out short-term market noise. By smoothing volatile price bars into a single fluid line, moving averages allow you to instantly determine whether an asset is trending upward, trending downward, or moving sideways.
In technical analysis, moving averages belong to the broader family of trend-following technical indicators used to establish quantitative market bias. The two primary variations used by active traders are the Simple Moving Average (SMA) and the Exponential Moving Average (EMA).
SMA Formula: (Price₁ + Price₂ + ... + Priceₙ) ÷ N
EMA Formula: (Current Price × Multiplier) + (Previous EMA × (1 − Multiplier)), where Multiplier = 2 ÷ (N + 1)
The Simple Moving Average calculates the arithmetic mean of a selected set of prices over a specific timeframe (such as 20, 50, or 200 periods). Every data point within the timeframe carries equal mathematical weight. When a new period closes, the oldest price point is dropped, and the newest price point is added.
The Exponential Moving Average applies a weighting factor that assigns greater mathematical emphasis to recent price bars. Because newer price data impacts the calculation more heavily, an EMA reacts significantly faster to sharp market reversals than an equivalent period SMA.
How Moving Averages Work: The Lag Trade-Off
Moving average lag is the natural delay between price movement and the indicator's reaction, caused by mathematical averaging of historical data points. Because moving averages are derived strictly from past closing prices, they can never predict future price action — they can only confirm established price movement.
Understanding how period settings alter indicator sensitivity is vital for managing risk inside a funded trading account:
Short-Term Period (9–20 periods): Hugs price action closely and turns rapidly during volatile swings. While short periods reduce lag, they generate frequent false signals during low-volatility sessions.
Medium-Term Period (50 periods): Smooths minor intraday fluctuations while maintaining reasonable sensitivity to structural market shifts. Useful for identifying intra-week pullback zones.
Long-Term Period (200 periods): Provides a macro view of institutional trend direction. The 200-period average changes direction slowly, rendering it immune to short-term noise but prone to substantial execution lag.
Choosing an indicator period involves a strict trade-off: shorter periods increase sensitivity to market noise, while longer periods increase execution lag. Attempting to eliminate lag entirely by shortening period lengths simply increases your exposure to erratic market noise.
Moving averages protect funded accounts by acting as systematic directional filters that prevent traders from executing counter-trend setups during high-volatility sessions. The most critical operational constraint in prop firm challenges is surviving daily equity drawdown rules.
When trading capital provided by an evaluation program, taking trades against the dominant trend dramatically increases your failure rate. A moving average functions as a binary directional permission filter:
Price above long-term EMA (e.g., 200 EMA): The macro trend is bullish. You are strictly permitted to evaluate long setups. Short setups are prohibited.
Price below long-term EMA (e.g., 200 EMA): The macro trend is bearish. You are strictly permitted to evaluate short setups. Long setups are prohibited.
Establishing structural rules around moving averages prevents emotional decision-making. When price trends strongly in one direction, counter-trend scalpers suffer rapid, repeated stop-outs.
By enforcing alignment with macro moving averages, you eliminate unnecessary trades, reduce overall transaction costs, and preserve daily drawdown limits for high-probability structural setups.
Many evaluation accounts are lost during quiet afternoon sessions when traders force counter-trend scalps against a steady 50 EMA trend line. Establishing a rule that forbids trading against the slope of the 50 EMA on your primary execution timeframe instantly cuts unnecessary drawdown losses by eliminating low-probability entries.
How to Apply Moving Averages in a Trading Strategy
Applying moving averages effectively in a funded trading account requires using them for trend confirmation and dynamic risk placement rather than standalone entry triggers.
Method 1: Dynamic Trend Bias
Before looking for entries, check the location and slope of your moving averages on higher timeframes (e.g., 4-hour or daily charts). If the 50 EMA is positioned above the 200 SMA and both lines slope upward, market structure confirms an uptrend. You only seek buy setups on your execution timeframe.
Method 2: Dynamic Support and Resistance
During strong, steady trends, price often pulls back toward key moving averages (such as the 20 EMA or 50 SMA) to seek liquidity. Instead of entering blindly as price hits the line, treat the moving average area as a dynamic zone of interest. Wait for candlestick confirmation — such as a bullish rejection tail — before taking an entry.
Method 3: Multi-Indicator Confluence
Never rely on a moving average in isolation. Increase entry probability by pairing dynamic moving average levels with structural support, horizontal resistance, or volume-weighted metrics like VWAP. When a 50-period SMA aligns precisely with a session VWAP level and a major support zone, the confluence creates a high-probability location to manage downside risk.
SMA vs. EMA Application Matrix for Funded Traders
Feature / Metric
Simple Moving Average (SMA)
Exponential Moving Average (EMA)
Calculation Weighting
Equal weight across all periods
Heavy weight on recent price bars
Reaction Speed
Slower (higher lag, smoother line)
Faster (lower lag, sharper turns)
Best Purpose in Strategy
Macro trend identification (e.g., 200 SMA)
Dynamic entries & trailing stops (e.g., 9/20 EMA)
False Signal Risk
Low in chop, slow to exit
High in chop, quick to exit
Funded Account Role
Absolute trend direction filter
Trailing exit mechanism to lock in profits
Common Traps: Why Moving Average Strategies Whipsaw Funded Accounts
Moving average strategies fail in evaluation challenges primarily when traders force mechanical crossover signals during rangebound price consolidation.
Trap 1: Mechanical Crossover Entries in Rangebound Markets
Standard retail courses often teach traders to buy when a fast moving average crosses above a slow moving average (a "golden cross"). In rangebound markets, price bounces back and forth within horizontal boundaries.
By the time a lagging moving average crossover occurs near the top of a range, the move is already exhausted. Buying the crossover results in buying the high of the range — just before price reverses. Experiencing consecutive crossover whipsaws during sideways market conditions can easily wipe out a 5% daily drawdown limit in a single session.
Trap 2: Treating Lagging Lines as Rigid Support/Resistance
Moving averages are calculated from historical settlement prices; they do not contain pending institutional orders. Treating a moving average line as a rigid level where price must bounce leads to premature entries. Price routinely pierces moving averages during intraday liquidity runs before resuming its primary trend direction.
Trap 3: Parameter Curve-Fitting
When a trading session results in losses, traders frequently alter their moving average settings (e.g., changing a 20 EMA to a 21 EMA or an 18 EMA) to make historical charts look perfect. This practice — known as curve-fitting — creates a false sense of security. Historical optimization cannot eliminate indicator lag or guarantee future performance.
If you catch yourself constantly adjusting moving average parameters between 14, 20, and 50 periods after a losing streak, stop immediately. Pick standard settings (like the 20 EMA and 200 SMA), keep them fixed, and focus entirely on whether market structure is trending or consolidating before executing trades.
Managing Risk With Moving Average
Moving averages serve as foundational risk management filters when trading funded accounts, helping you align entries with macro flow and avoid low-probability setups. By understanding the lag trade-off between SMAs and EMAs, you can structure dynamic trend filters that preserve daily drawdown limits and keep your trading systematic. Once you know how to use moving averages as filters rather than triggers, your entries become far more disciplined.
FAQ
What is the difference between an SMA and an EMA?
A Simple Moving Average (SMA) calculates the arithmetic mean of price data equally across all periods. An Exponential Moving Average (EMA) assigns heavier mathematical weighting to recent price bars. Consequently, EMAs react faster to price changes, making them useful for dynamic trailing stops, while SMAs provide a smoother, lag-tolerant view of macro trend direction.
Which moving average period is best for day trading?
Day traders often use fast moving averages like the 9 EMA or 20 EMA to track short-term intraday momentum and dynamic support. However, no single period setting is best for every market condition. Shorter periods increase sensitivity to price noise, while longer periods like the 50 SMA or 200 SMA offer cleaner macro trend filtering at the cost of execution lag.
How do moving averages act as dynamic support and resistance?
During strong trend phases, price action frequently retraces toward key moving averages like the 20 EMA or 50 SMA before resuming its primary direction. Rather than fixed price levels, these moving average lines create dynamic support or resistance zones where traders look for candlestick rejection signals and volume confirmation to manage risk effectively.
Why do moving average crossover strategies fail in choppy markets?
Moving averages are lagging indicators derived from historical price calculations. When markets move sideways in a range, fast and slow moving averages cross repeatedly near the outer boundaries of the consolidation. Entering mechanically on these lagging crossover signals forces traders to buy range highs and sell range lows, causing consecutive whipsaw losses that threaten account drawdown limits.
Should funded traders use moving averages as primary entry signals?
No. Funded traders should use moving averages primarily as directional filters to determine trade permission (e.g., only buying above a 200 EMA) and as dynamic risk zones. Relying on moving averages as primary entry triggers introduces execution lag and slippage, which increases open equity drawdown risks during high-volatility market conditions.
Disclaimer
Disclaimer: This guide was written with AI assistance, reviewed for accuracy by the Proptary editorial team, and kept up to date. It's for education only — not financial advice. Prop trading and the financial markets carry a significant risk of loss, so consider your own situation and consult a licensed advisor before you trade.
Proptary editorial team independently reviews prop trading firms, verifies payouts, and explains the rules that decide who keeps an account. We disclose affiliate relationships and publish methodology for every score.