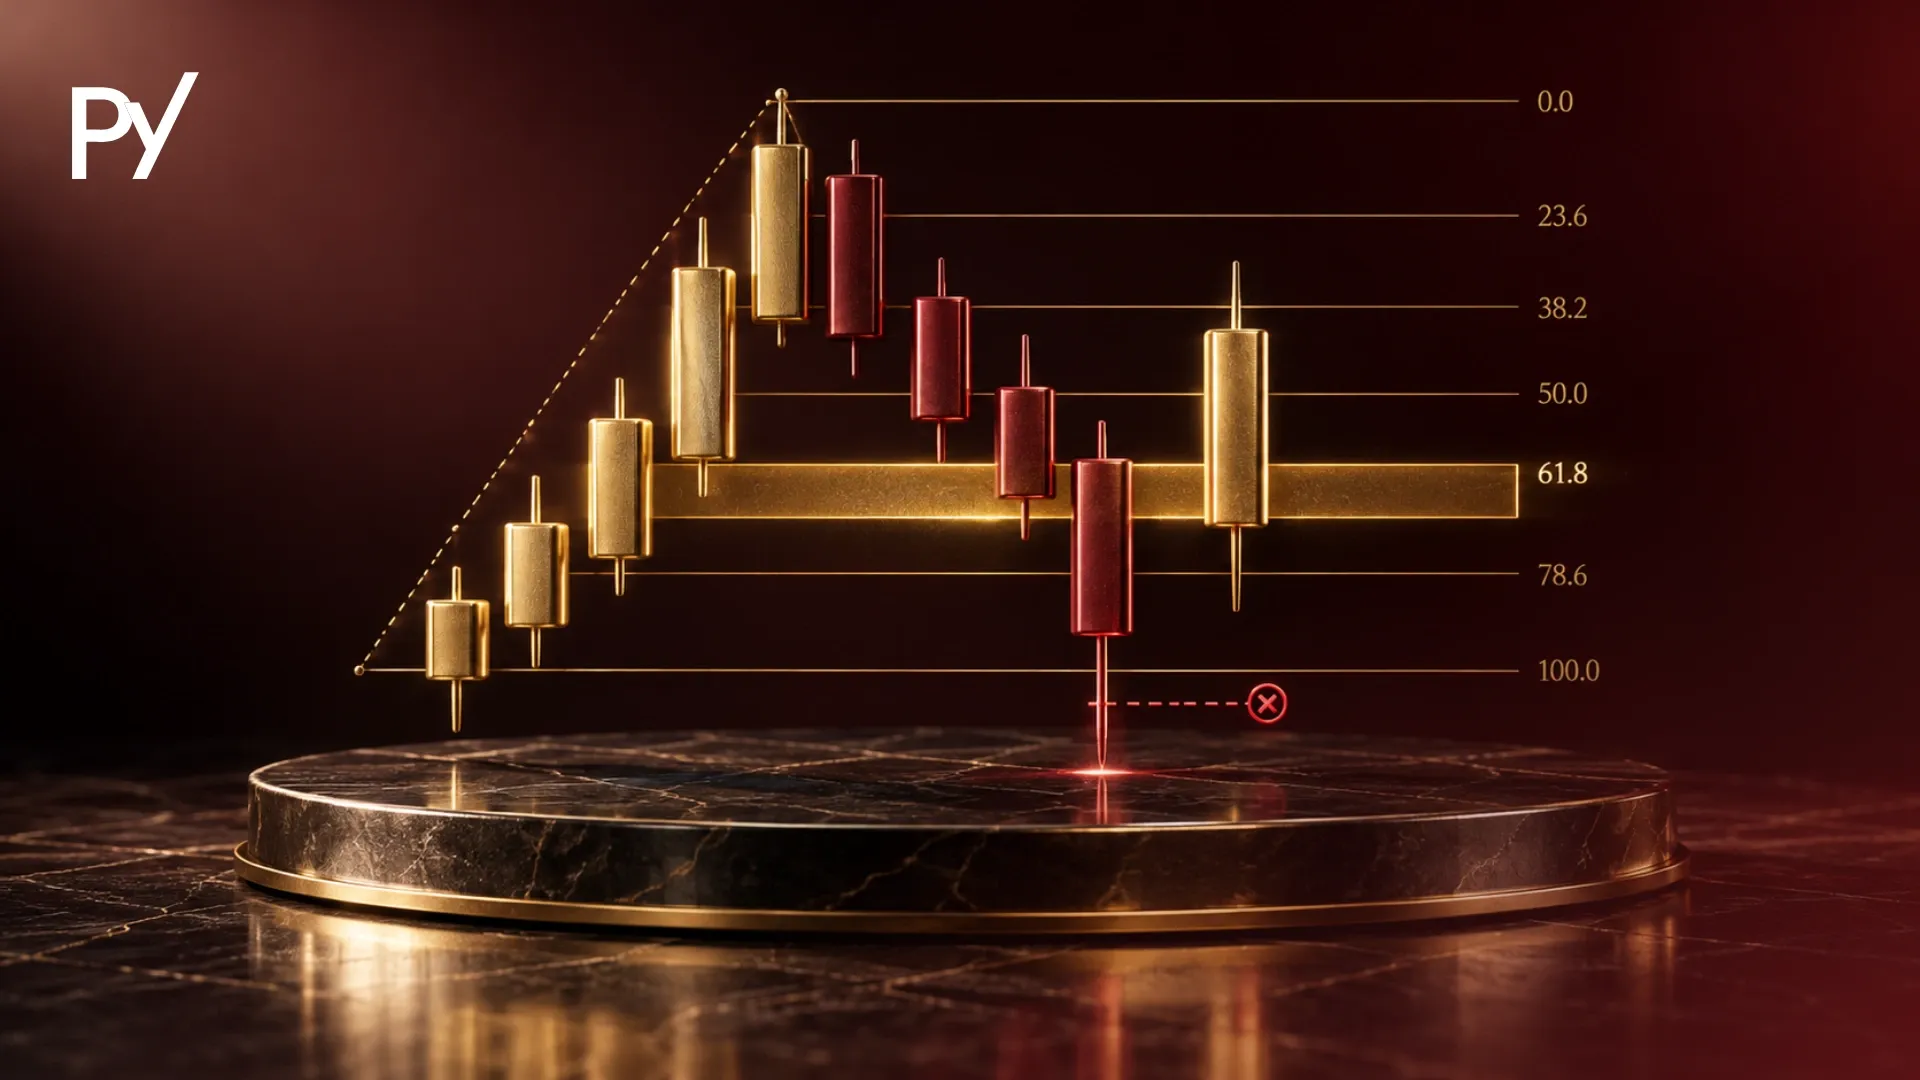
An equity curve is a graphical representation of an account's cumulative net capital plotted over time or completed trades. For prop traders, it diagnoses trading edge while exposing intraday floating drawdown spikes that can breach trailing loss limits even when closed trades are profitable. Tracking both closed balance and floating equity prevents reliance on holding severe unrealized losses.
An equity curve is a graphical representation of your trading account’s total net value plotted sequentially over time or across individual trades. It tracks the cumulative financial trajectory of your strategy by mapping realized gains, losses, and real-time open positions.
Most funded traders obsess over their end-of-day profit targets while completely ignoring the underlying health of their performance graph. A smooth, upward-sloping balance line can easily conceal violent intraday drawdowns that sit inches away from breaching prop firm loss limits. This guide breaks down the structural mechanics of your curve, the hidden disparity between closed balance and floating equity, and how to audit your performance to keep your funded account secure.
Your account balance can look healthy while your open trades quietly eat into your drawdown limit. This guide shows you how to read an equity curve, spot the hidden risk in floating equity, and avoid the curve patterns that can end funded accounts.
What Is an Equity Curve? (Core Definition & Anatomy)
An equity curve is a chart of how your account balance changes from your first trade to today. Rather than viewing individual wins and losses in isolation, the curve aggregates every execution into a continuous financial narrative. It serves as an objective diagnostic tool, stripping away short-term emotional bias to reveal whether your strategy possesses a statistical edge, suffers from erratic variance, or relies on unsustainable risk-taking.
Every performance graph consists of four fundamental structural components:
High-Water Mark (Peak): The highest cumulative equity level your account has achieved to date. This milestone acts as the reference point against which drawdowns, trailing risk limits, and recovery metrics are calculated.
Drawdown (Trough): The peak-to-valley decline in account equity, measured in either percentage terms or absolute currency. It reflects the capital lost before reaching a new high-water mark.
Run-Up (Expansion): The upward phase of the curve where successive trades produce net capital growth, driving the account toward new high-water marks.
Plateau (Stagnation): Extended sideways phases where your account neither reaches new peaks nor enters deep drawdown. Stagnation measures how long your capital remains underwater.
Understanding your trading equity curve requires choosing the right axis for your analysis. You can plot your performance using two distinct methods:
Trade-Based Curves: This method plots your account balance after each closed trade, regardless of how much calendar time elapsed between executions. Trade-based plotting isolates mathematical edge from market exposure, providing a clean look at trade expectancy, win-loss distribution, and system consistency.
Time-Based Curves: This method plots equity across specific intervals, such as daily, weekly, or monthly intervals. Time-based plotting incorporates the opportunity cost of holding positions and reveals whether your system generates steady returns across changing market sessions or suffers during specific macro regimes.
Closed Balance vs. Open Floating Equity: The Prop Drawdown Trap
A closed balance curve reflects only the capital secured after positions are fully exited, whereas an open floating equity curve accounts for real-time, mark-to-market price fluctuations of active trades. Relying exclusively on a closed balance curve is an easy mistake to make. A balance chart can show a pristine, steady 45-degree angle of uninterrupted growth while completely hiding the fact that open positions regularly dipped deep into negative territory before recovering.
Under many prop firm rules, that hidden volatility can be catastrophic. Many prop challenges do not calculate maximum drawdown from closed daily balances alone. Some apply intraday trailing drawdowns that track your peak floating equity in real time, so always check your firm’s own drawdown rules before you trade.
On accounts with an intraday trailing drawdown, if your open trade runs into positive territory, that unrealized profit instantly pulls your trailing drawdown floor upward. When the trade subsequently pulls back, your account balance drops toward a floor that never moved down with it.
Metric / Stage
Account Balance / Equity
Trailing Drawdown Floor
Resulting Impact
Starting Account
$100,000 balance
$95,000 (5% max drawdown limit)
Baseline risk floor established
Unrealized Floating Peak
$104,000 open equity
$99,000 (ratchets up by $4,000)
Loss floor permanently locked at new peak
Intraday Pullback
$98,800 open equity
$99,000
Account liquidated ($200 below floor)
Intended Trade Close
$100,500 closed balance
$99,000
Trade is green, but account is already terminated
Consider a funded trader managing a $100,000 account with a 5% maximum trailing drawdown limit ($95,000 floor). The trader enters a long position that floats up to $104,000 in unrealized profit. Under peak-equity trailing models, the maximum loss limit immediately trails up to $99,000 ($104,000 minus $5,000).
If the market reverses and the trader closes the position at a modest profit of $100,500, their closed balance graph shows a clean winning trade. However, if that intraday pullback dipped to $98,800 before bouncing back, the prop firm’s automated risk engine would have instantly liquidated the account for a maximum drawdown breach, even though the trade ended green.
If you only analyze your closed-trade statistics, you are evaluating half of your risk profile. Auditing both closed and mark-to-market curves helps you check whether your strategy relies on holding losing trades through severe negative excursions just to print green closed trades on your dashboard.
What Your Trading Equity Curve Reveals About Edge and Risk
The visual geometry of your performance curve reveals the underlying mechanics of your statistical expectancy (the average amount you can expect to win or lose per trade), risk management, and execution discipline. A disciplined strategy produces an upward trend characterized by steady, shallow pullbacks, whereas high-variance gambling patterns generate distinct visual warning signs.
The trajectory of your curve directly reflects your system’s underlying profit factor (total profits divided by total losses) and win-loss ratio. A strategy with a high win rate and small average gains typically displays a smooth, consistent climb punctuated by occasional sharp dips. Conversely, a trend-following system with a lower win rate and high reward-to-risk ratio creates a staircase pattern: long horizontal plateaus broken by sudden, vertical upward surges when outsized trends materialize.
Curve Characteristic
Underlying System Reality
Prop Account Vulnerability
Smooth, Near-Vertical Rise
Often linked to extreme position sizing, over-leveraging, or Martingale-style doubling down.
High risk of sudden, total account liquidation on a single adverse run.
Jagged, High-Volatility Swings
Wide stops, unmanaged sizing, or poor reward-to-risk execution.
Prone to tripping strict intraday daily loss thresholds.
Prolonged Flat Stagnation
Low trade frequency, poor market conditions, or break-even scratch trading.
Triggers trader fatigue, boredom trades, and rule abandonment.
Consistent Diagonal Trend
Conservative risk per trade (commonly 0.5%–1%, though suitable levels vary by trader and firm rules) with positive mathematical expectancy.
Better suited to long-term funded scaling, though no curve pattern guarantees consistent payouts or future results.
When diagnosing risk, drawdown duration is often far more dangerous than drawdown depth. While maximum drawdown depth measures the total percentage drop from a peak, drawdown duration measures how many trades or days your account remains below its previous high-water mark.
A shallow drawdown that lasts six weeks can test an operator’s psychological resilience far more severely than a 3% dip that recovers in two sessions. Extended stagnation can lead to frustration, prompting some traders to increase position size, abandon their edge, and force low-probability setups just to break even.
What Is Equity Curve Trading — And Does It Work Under Prop Rules?
Equity curve trading is an active risk-management technique where you apply quantitative indicators—such as simple moving averages (SMA) or trendlines—directly to your performance curve to systematically scale risk up, scale down, or pause execution. Rather than adjusting risk based on subjective sentiment, you treat your own equity performance as an asset price chart.
Under standard implementation, a trader plots an indicator, such as a 20-trade simple moving average, over their closed equity:
When equity is above the moving average: The system is in a favorable market regime; you trade your baseline risk allocation (e.g., 1% risk per trade).
When equity crosses below the moving average: The system may be out of sync with the market. You cut your risk to a defensive level (e.g., 0.25% per trade) or move to a demo account until the curve climbs back above the average.
While this approach may help limit losing streaks in private capital accounts, applying strict equity curve trading inside prop firm challenges introduces a severe mechanical paradox.
In a challenge phase, you are operating under tight profit targets alongside strict drawdown caps. If your equity drops below a moving average and you defensively cut position sizing to one-quarter of standard risk, you lower your system’s compounding rate.
When your edge regains traction, your subsequent winning trades will be executed at defensive sizes. It can require an extended sequence of winning trades simply to recover lost ground, making it statistically difficult to reach the evaluation profit target before incurring cumulative rule violations or running out of patience.
Backtest Illusion vs. Live Execution Friction
A backtested performance graph almost always displays an unrealistically smooth trajectory compared to a live trading curve. Simulation engines operate in idealized environments where orders fill instantly at exact prices, spreads remain static, and liquidity is virtually infinite. Once you deploy that strategy into a live funded account, real-world execution friction immediately degrades the curve’s slope.
Four major friction factors erode live performance:
Slippage and Spread Widening: During high-impact economic releases or low-liquidity session rollovers, spreads expand significantly. Market orders fill ticks away from your intended entry or stop-loss, compounding cumulative losses.
Commission and Financing Costs: High-frequency strategies that look profitable in backtests can produce negative equity curves once broker commissions, exchange fees, and overnight swap charges are deducted.
Execution Latency: Millisecond delays between trade transmission and fill price create negative slippage that compounds over hundreds of executions.
Sequence Risk: Backtests present one single historical trade sequence. In live trading, that identical strategy could easily experience its worst-case losing run right at the start of your evaluation phase.
To evaluate whether your curve can survive live execution without violating prop firm rules, you must run Monte Carlo simulations. A Monte Carlo analysis takes your historical trade distribution and shuffles the sequence of wins and losses across 1,000 or more randomized iterations.
This modeling strips out sequential luck and exposes the true mathematical probability of experiencing consecutive losses. If a 1,000-run simulation shows a 12% probability of hitting an 8% drawdown trough, your system is poorly calibrated for a funded account with a 5% maximum drawdown limit, regardless of how attractive the single backtested curve appears.
3 Critical Equity Curve Traps That Blow Funded Accounts
An equity curve serves as a visual mirror of execution discipline, making dangerous operational habits immediately apparent. Three recurring structural curve patterns are commonly linked to blown funded accounts.
1. The Martingale Ridge (The Cliff Pattern)
This pattern appears as an unnaturally smooth, uninterrupted 45-degree ascent, followed by a sudden vertical collapse that completely wipes out the account. It is often the hallmark of averaging down into losing trades, using Martingale sizing, or removing stop-losses.
Because the trader refuses to take small losses, the closed balance curve ascends steadily as long as the market eventually pulls back. However, the moment a sustained trend moves against the position without retracing, a single liquidation event instantly terminates the funded account.
2. The Intraday Excursion Mask
Traders caught in this trap showcase an orderly closed balance curve while operating dangerously close to their maximum daily loss limits. They routinely allow trades to run into deep negative floating territory, relying on late-session mean reversion (price drifting back toward its average) to exit flat or with a nominal gain.
While their closed-trade metrics appear stable on paper, their open equity can swing sharply. It only takes a single minor liquidity shock or unexpected news spike to trigger the firm’s automated daily liquidation threshold during market hours.
3. The Strategy-Tinkering Stagnation Trap
This mistake manifests on the performance graph as an initial upward trend that deteriorates into a chaotic, erratic series of choppy peaks and troughs. When a trader enters a statistically normal drawdown plateau, they panic and assume their edge has disappeared.
They begin altering parameters mid-challenge—switching indicators, shortening timeframes, or adding arbitrary trade filters. By modifying strategy rules during a standard variance cycle, they truncate the recovery phase, missing the winning trades that restore expectancy and causing the curve to grind downward indefinitely.
Equity Curve Takeaways for Funded Traders
A healthy performance curve is not defined by an absence of drawdowns, but by how predictably and safely your system recovers from them. Long-term funded traders focus on preserving capital through proper position sizing and auditing open floating equity excursions rather than chasing artificially smooth balance lines. Recognizing that drawdown plateaus are an unavoidable component of statistical expectancy prevents the premature strategy modifications that destroy viable funded accounts.
To build the discipline, risk frameworks, and execution consistency necessary to safeguard your capital under strict challenge rules, explore our comprehensive guide on trading skills for funded traders.
FAQ
What does a healthy trading equity curve look like in a funded account?
A healthy performance curve does not require a flawless, unbroken upward line. Instead, it features a steady diagonal slope with shallow, predictable drawdowns and rapid recovery phases. The curve should show consistent progress without dramatic vertical surges or sharp, cliff-like drops, which can suggest that returns stem from statistical edge and disciplined position sizing rather than reckless over-leveraging.
What is an underwater equity curve, and why does it matter?
An underwater curve, or drawdown chart, plots only the percentage and duration your account remains below its previous high-water mark. Rather than tracking total capital growth, it shows 0% at every new peak and how far below that peak your account sits at any other time. It helps funded traders evaluate drawdown duration—the length of time spent in stagnation—which can trigger impatience, emotional rule-breaking, and broken challenge rules.
Can using moving averages on an equity curve protect a prop challenge?
While applying moving average filters to an equity curve can reduce peak drawdown in personal accounts, it often hampers prop challenge performance. Scaling down risk when equity drops below a moving average can dampen compounding rates, sometimes requiring a long streak of winning trades to reach challenge profit targets once market conditions normalize and the strategy recovers.
Why does a live funded equity curve degrade compared to backtesting?
Many backtests run in simplified environments with instant execution, little or no slippage, and static spreads. In live funded accounts, real-world execution costs—such as spread widening around economic releases, commission drag, overnight financing fees, and broker latency—systematically reduce trade profitability. Additionally, sequence risk can introduce severe losing streaks early in live trading that idealized backtests average out.
Should prop traders plot equity curves by trade or by calendar time?
You should analyze both, as they provide distinct diagnostic insights. Trade-based curves plot performance execution by execution, isolating pure mathematical expectancy and win-loss distribution from market exposure. Time-based curves plot equity daily or weekly, capturing the drag of overnight swap fees, weekend risk exposure, and performance variations across different market regimes and volatility cycles.
Disclaimer
Disclaimer: This guide was written with AI assistance, reviewed for accuracy by the Proptary editorial team, and kept up to date. It's for education only — not financial advice. Prop trading and the financial markets carry a significant risk of loss, so consider your own situation and consult a licensed advisor before you trade.
Proptary editorial team independently reviews prop trading firms, verifies payouts, and explains the rules that decide who keeps an account. We disclose affiliate relationships and publish methodology for every score.