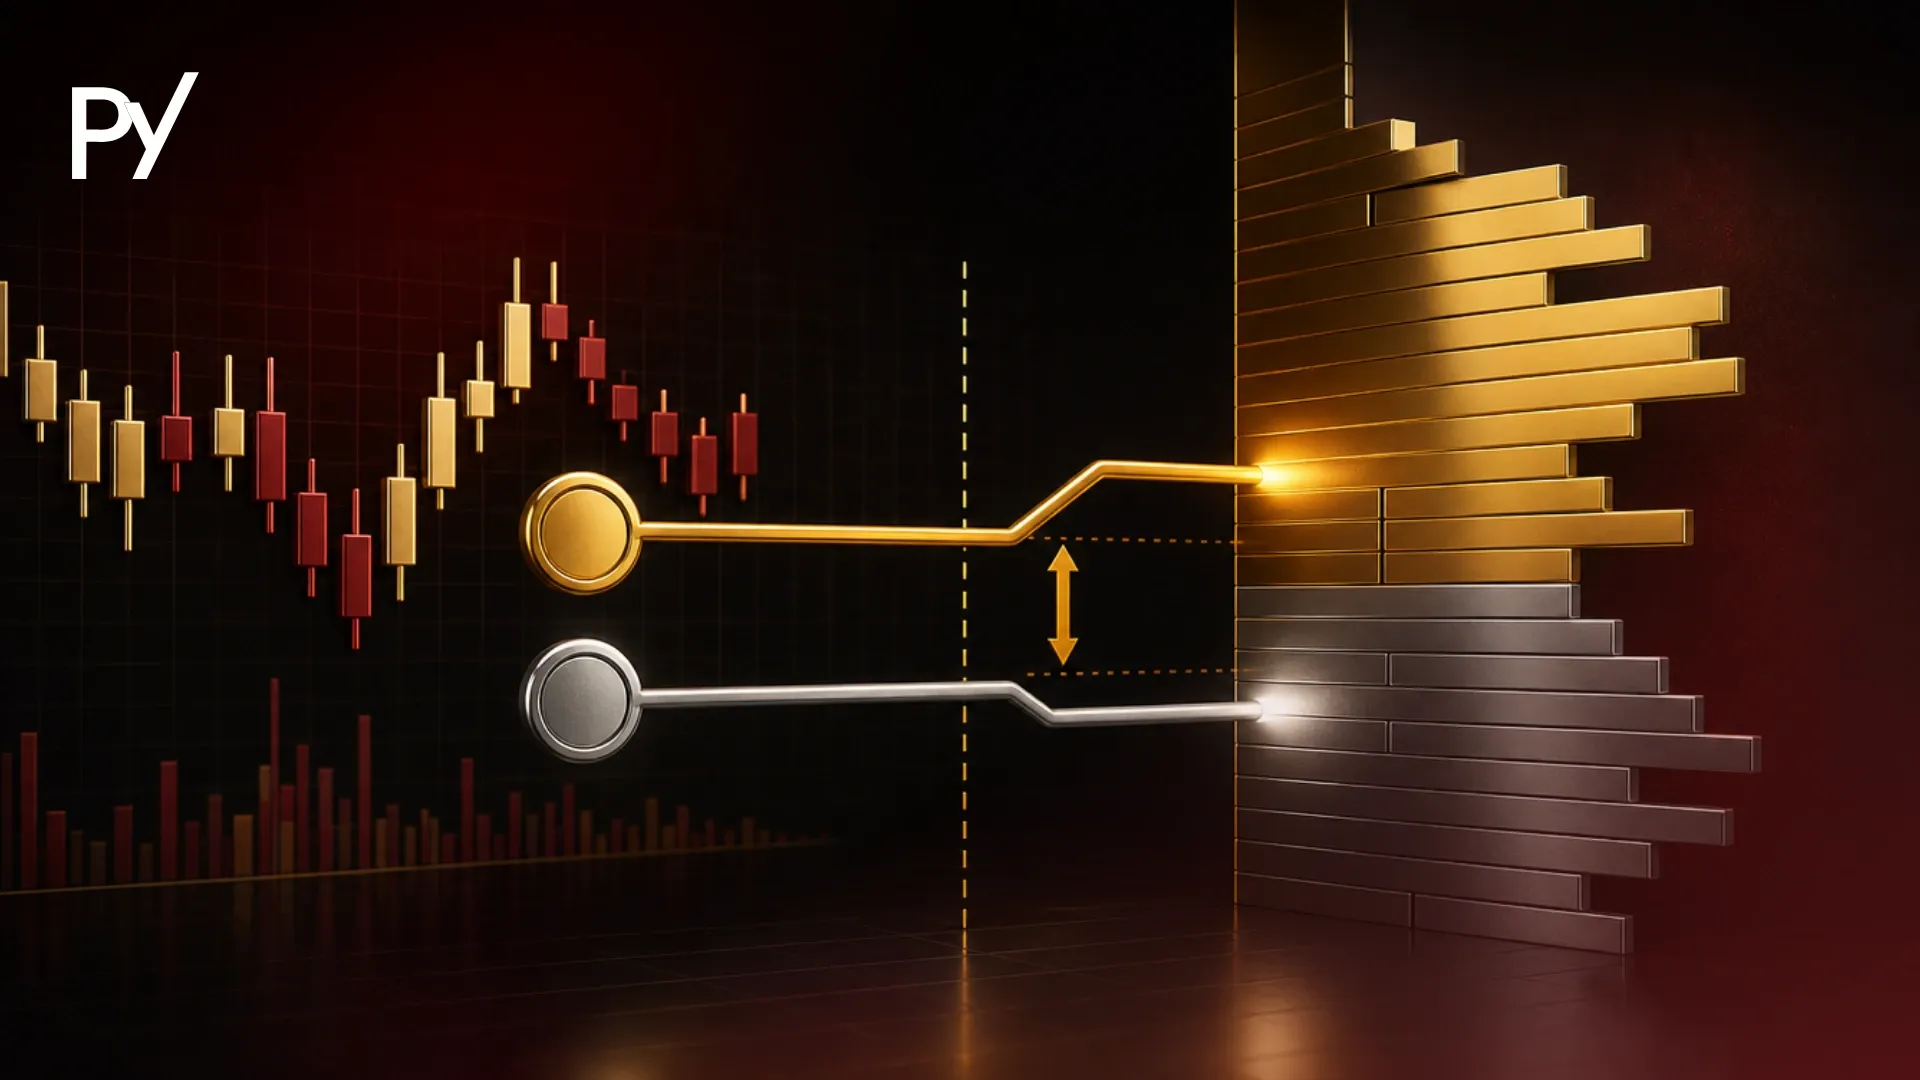
Heikin Ashi is a Japanese candlestick technique that averages price data to smooth volatility and clarify trend direction. Its Open, High, Low, and Close values are synthetic, but real orders fill at live Bid/Ask prices. That means a live price spike can breach prop firm drawdown limits while the smoothed candle still looks safe.
Heikin Ashi, meaning "average bar" in Japanese, is a modified candlestick technique that averages price data to smooth out market volatility and highlight trend direction.
Watching a volatile chart can shake you out of a winning trade too early, making a smoothed visual appealing. However, trading these synthetic prices inside a funded account introduces a blind spot where live market wicks can breach your drawdown limits while the chart looks calm. This guide covers the calculation mechanics, execution disparities, and exact drawdown risks when trading with these charts.
Quick Takeaways
1These candles recalculate standard Open, High, Low, and Close values into smoothed averages to eliminate market noise.
2This chart type displays synthetic prices, while real market orders execute strictly at live Bid/Ask prices.
3Price smoothing introduces visual lag, and candle color and body size can look calm while live price moves far enough to breach prop firm drawdown limits.
4Using synthetic wicks for stop-loss calculations distorts position sizing and actual risk-to-reward ratios.
5Combining this smoothing technique with objective trend tools creates a disciplined execution process without ignoring live market risks.
What Is Heikin Ashi?
This technique is a visual charting filter that replaces raw market fluctuations with averaged price data to clarify the underlying trend. Instead of showing the exact price a market opened or closed at during a specific timeframe, it feeds previous and current price points into a formula to create a synthetic representation of market momentum.
On a standard Japanese candlestick chart, strong trends are frequently interrupted by alternating red and green candles. This visual noise often triggers emotional reactions, causing traders to close positions prematurely out of fear that a minor pullback is a full reversal. The smoothed chart removes this friction. During a strong bullish trend, the chart will display consecutive green candles with flat bottoms and no lower wicks. In a strong bearish trend, it prints consecutive red candles with flat tops and no upper wicks.
A wick is the thin line above or below a candle’s body that marks the highest or lowest price reached during that period.
This modified visual structure provides a psychological advantage. By filtering out the micro-fluctuations, the chart helps you stay in winning trades longer and prevents you from reacting to minor intraday price swings. However, this clarity comes at the cost of execution accuracy, as the chart no longer reflects the exact prices where buyers and sellers are actually transacting.
The Heikin Ashi Formula: Synthetic Price vs. Live Execution
The formula calculates synthetic prices by averaging the current and previous standard candlestick data, creating a delayed visual representation of the market. To understand why the chart looks the way it does—and why it poses a risk inside a prop firm challenge—you have to look at the four calculations driving it.
The formula modifies the traditional Open, High, Low, and Close (OHLC) data. In the four calculations below, HA stands for Heikin Ashi:
HA Close: (Open + High + Low + Close) / 4. This is the average price of the current standard candlestick.
HA Open: (Previous HA Open + Previous HA Close) / 2. This is always the exact midpoint of the previous smoothed candle's body, which is why the candles appear to connect seamlessly.
HA High: The maximum value chosen from the current standard High, the HA Open, or the HA Close.
HA Low: The minimum value chosen from the current standard Low, the HA Open, or the HA Close.
Value
Standard candlestick
Heikin Ashi candle
Open
Actual opening price of the period
Midpoint of the previous HA Open and HA Close
Close
Actual closing price of the period
Average of the standard Open, High, Low, and Close
High
Actual highest price of the period
Maximum of the standard High, the HA Open, and the HA Close
Low
Actual lowest price of the period
Minimum of the standard Low, the HA Open, and the HA Close
Relation to live execution
Reflects prices where trades occurred
Synthetic values; orders still fill at live Bid/Ask prices
The critical disparity here is that you trade the live market, not the chart. When you execute a market order, your broker fills you at the live Bid or Ask price. If you are looking at a smoothed chart, the price level currently displayed on your screen is an average of past data, not the live execution price. If the actual market price drops sharply but the formula averages it out, your open equity takes the hit in real-time, even if the synthetic candle on your screen remains green.
The Bid is the price at which you can sell, and the Ask is the price at which you can buy.
Trading Heikin Ashi Under Prop Firm Constraints
Using this chart type under prop firm constraints requires trading off delayed entry and exit signals for a clearer view of the macroeconomic trend. When your goal is passing an evaluation, the primary objective is protecting your account from drawdown breaches, which changes how you must utilize price smoothing.
The immediate cost of averaging price data is visual lag. Because the smoothed open is based on the previous candle's midpoint, it takes longer for the chart to register a change in market direction. By the time a flat-bottom green candle flips to a red candle with a lower wick, the live market price may have already reversed significantly.
This lag compresses your risk-to-reward (R:R) ratio. If you wait for a smoothed-candle color change to confirm your entry, you are entering the market at a worse price than you would on a standard chart. If you wait for an opposite color change to exit, you give back a larger portion of your floating profits. Inside a prop firm challenge with a strict daily loss limit, giving back unnecessary pips on delayed exits quickly eats into your permitted drawdown budget.
Tip: Many traders get caught off guard when a smoothed candle shows a strong bullish trend with no lower wick, yet their stop loss triggers. I've learned to always keep a secondary screen open with raw price action so I can see the actual Bid/Ask spread while using the smoothed chart purely to hold the directional bias.
Integrating Heikin Ashi with Technical Indicators
This chart type functions best as a directional filter rather than a standalone signal generator when integrated into a broader trading system. Relying solely on the color changes of averaged candles is not a complete strategy, especially when those candles obscure live market data.
To maximize its utility, you should align this noise reduction with objective technical indicators that measure actual market volume and momentum. For example, using the smoothed chart on a higher timeframe (like the 4-hour) helps you identify the dominant trend direction without being distracted by intraday pullbacks. You can then drop to a lower timeframe standard chart to execute precise entries at live market prices.
Combining this charting method with a momentum-based tool like the supertrend indicator provides a rule-based approach. The supertrend line calculates trailing support and resistance based on real volatility (Average True Range), while the Heikin Ashi candles visually confirm whether the momentum is sustaining itself. If both tools align, you may have a stronger directional bias that filters out market noise while anchoring your risk management to objective volatility data, although no combination of indicators guarantees an outcome.
The Heikin Ashi Drawdown Traps: 3 Mistakes That Breach Funded Accounts
The visual smoothing of these candles hides live market volatility, creating three specific traps that can trigger a hard breach on a funded account. Because prop firms monitor your equity in real-time, relying completely on a synthetic chart exposes you to rule violations that may not appear on your screen.
Trap 1: The Trailing Drawdown Blind Spot
Trailing drawdown rules track your highest open equity, not just closed trades. If a live market news spike creates a 30-pip downward wick, your real-time equity absorbs that full 30-pip loss instantly. If that equity dip crosses your trailing limit, you lose the account immediately. The trap is that a smoothed candle can still look bullish after the spike. The lower wick does record the real low, because the HA Low takes the minimum of the standard Low, the HA Open, and the HA Close. A trader who reads only candle color or body size can overlook it, while the firm dashboard has already logged a breached account.
Trap 2: Delayed Exits and Slippage Exposure
Funded accounts demand precise risk management. If you hold a losing position while waiting for a smoothed candle to change color and confirm the reversal, you are subjecting your account to severe lag. During high-impact events or rapid liquidity shifts, the live market price moves much faster than the averaged chart. Slippage is the difference between the price you expect and the price at which your order actually fills. Waiting for the visual confirmation means you will likely suffer worse slippage and take a larger loss than you budgeted for, pushing you unnecessarily close to your daily loss limit.
Trap 3: Distorted Position Sizing
This is a mechanical error that distorts every trade sized from a synthetic wick. If you calculate your lot size by measuring the distance from your entry to the bottom wick of a smoothed candle, your math is flawed. The synthetic wick does not represent the actual market low. If you size your position based on a 10-pip synthetic wick, but the real market structure demands a 20-pip stop loss to stay out of the noise, you are unintentionally doubling your risk exposure. When the live market retests the actual low, you will hit your stop loss and take double the intended dollar-value loss.
Conclusion
Heikin Ashi can be a useful tool for filtering market noise and maintaining the discipline to hold winning trades during minor pullbacks. The psychological benefit of seeing consecutive, clean trend candles can be significant, especially when battling the pressure of a prop firm evaluation.
However, trading is executed in the live market, not inside a mathematical average. You must account for the execution disparity, visual lag, and the hidden drawdown risks that synthetic wicks obscure. To effectively navigate funded-account rules without falling into these traps, explore how other indicators, such as the momentum indicator and the CCI indicator, can build out your strategy.
Disclaimer: This guide was written with AI assistance, reviewed for accuracy by the Proptary editorial team, and kept up to date. It's for education only — not financial advice. Prop trading and the financial markets carry a significant risk of loss, so consider your own situation and consult a licensed advisor before you trade.
FAQ
Does Heikin Ashi show real market prices?
No, these charts display synthetic price levels generated by averaging past and current price data. While standard candles plot exact transaction prices, Heikin Ashi recalculates the Open, High, Low, and Close into smoothed averages. All live market orders and stop losses execute against actual Bid/Ask market prices, not the synthetic values displayed on the chart.
Why does Heikin Ashi lag behind standard candlestick charts?
It lags because its formula incorporates previous candle midpoints and current averages to calculate new bars. Because the current candle's open is always set to the midpoint of the prior candle, it takes several price ticks for a trend reversal to visually manifest as a color change. This built-in averaging delays both entry signals and exit warnings compared to raw price action.
Can I use Heikin Ashi to calculate position sizing or stop losses?
You should not set stop losses or size positions directly off synthetic wicks. Because the Heikin Ashi High and Low are drawn from the standard High and Low combined with the synthetic Open and Close, the wicks can differ from the true market high or low. Placing a stop loss on a synthetic wick often results in premature stop-outs or unintentional risk doubling when live price volatility retests actual support and resistance levels.
How do Heikin Ashi charts trigger unexpected trailing drawdown breaches?
Trailing drawdown limits track your peak open equity in real-time. If a fast market spike occurs, your live account equity drops instantly, potentially breaching your limit. Because the smoothed body and color can look calm even when a live spike hits, a trader who reads only the candle body may not register how far equity fell, and the drawdown breach is already recorded on the firm dashboard.
What is the best way to use Heikin Ashi for prop firm evaluations?
The safest approach is using it on higher timeframes purely as a trend and noise filter to maintain directional bias. For trade execution, entry timing, and precise risk placement, always switch to a standard candlestick chart or keep a dual-chart setup displaying live Bid/Ask prices so you manage real-time account risk accurately.
Disclaimer
Disclaimer: This guide was written with AI assistance, reviewed for accuracy by the Proptary editorial team, and kept up to date. It's for education only — not financial advice. Prop trading and the financial markets carry a significant risk of loss, so consider your own situation and consult a licensed advisor before you trade.
Proptary editorial team independently reviews prop trading firms, verifies payouts, and explains the rules that decide who keeps an account. We disclose affiliate relationships and publish methodology for every score.