The Alligator indicator is a Bill Williams trend tool that plots three Smoothed Moving Averages (13, 8, and 5 periods) shifted forward by 8, 5, and 3 bars. Intertwined lines signal a sideways range; separated, sloping lines signal a trend. For funded traders, it works best as a filter against choppy sessions, not as a standalone entry system.
The Alligator indicator is a trend-following technical tool created by Bill Williams in 1995 that uses three forward-shifted Smoothed Moving Averages to separate directional price trends from sideways market ranges.
If you've ever burned half your prop firm daily loss limit forcing trades during a dead, choppy session, you already know how expensive directionless price action can be. Keeping your funded account alive means sitting out low-probability ranges and only committing risk when momentum actually expands. Below, you'll learn how the indicator works, what its four phases signal, and the lag traps that blow challenges.
Alligator Indicator Meaning: Why Bill Williams Built It
The Alligator indicator exists to keep you out of flat, directionless markets (where prices churn sideways without follow-through) and highlight when sustained directional momentum starts.
Trader and author Bill Williams introduced the tool in his 1995 book Trading Chaos. His core observation was straightforward: financial markets spend roughly 70% to 85% of their time moving sideways in non-trending ranges, while the remaining 15% to 30% accounts for sustained directional moves. Most retail traders lose money not because they misread strong trends, but because they overtrade during the quiet, directionless majority and get chewed up by false breakouts, spreads, and commissions.
To make trend state obvious at a glance, Williams modeled the indicator after an alligator's daily cycle of sleeping, waking up, eating, and resting. Strip away the animal metaphor, and the alligator indicator meaning comes down to moving-average convergence versus divergence:
Convergence (lines tangled together): Short-, medium-, and long-term average prices are essentially equal. Neither buyers nor sellers control order flow, so breakout attempts tend to snap back into the range.
Divergence (lines fanning apart): Short-term price momentum is pulling decisively away from medium- and longer-term averages, signaling that institutional participation or sustained order flow is driving a directional trend.
Inside a prop firm evaluation, understanding that distinction is critical. You don't get extra points for taking twenty mediocre trades in a flat Asian or pre-market session, and every unnecessary stop-out eats directly into a strict daily loss buffer.
Alligator Indicator Explained: The 3 Lines and Formula
The indicator plots three Smoothed Moving Averages (SMMAs) calculated from each bar's median price and projected forward into future bars on your chart.
If you want the alligator indicator explained without unnecessary math fog, start with what each line measures. Unlike a standard Simple Moving Average (SMA) that weighs every candle in a lookback window equally, an SMMA gives weight to the entire historical series while smoothing out abrupt single-bar spikes. Instead of using closing prices, Williams built the formula on each bar's midpoint: known as the median price:
Median Price = (High + Low) / 2
From that median price, charting platforms compute three separate SMMA lines and shift each one forward into empty chart space to the right of the current candle:
Fastest trigger line; reacts first to shifts in price
Here is how the smoothing formula updates each bar once the initial SMA seed is established:
SMMA = [Previous SMMA × (N - 1) + Current Median Price] / N
In that equation, N represents the lookback period (13, 8, or 5). Because each line is shifted forward by 8, 5, or 3 bars, the lines extend past the latest live candlestick. Visually, that forward offset separates the moving averages from the candles so you can immediately see whether price is trading cleanly above or below the structure. Mechanically, however, smoothing plus forward shifting makes the Alligator a lagging indicator: it confirms trends after they begin rather than predicting tops or bottoms in advance.
The 4 Market Phases of the Williams Alligator
The spacing and slope of the Jaw, Teeth, and Lips cycle through four distinct phases that tell you whether price is consolidating, breaking out, trending, or losing momentum.
1. Sleeping (Lines Intertwined)
When the blue Jaw, red Teeth, and green Lips lie flat and weave back and forth across one another, the indicator is in its sleeping phase. Price is locked in equilibrium, and candles repeatedly cross all three lines in both directions. According to Williams' framework, the longer the lines stay tightly compressed, the stronger the eventual directional expansion tends to be: though the lines give zero clue which way price will break until momentum actually arrives.
2. Waking Up (Initial Crossover)
When a catalyst or order-flow imbalance pushes price out of equilibrium, the fast 5-period green Lips cross above (bullish pressure) or below (bearish pressure) the red Teeth and blue Jaw. Price candles begin closing cleanly outside all three lines rather than slicing through them. This transition warns you that range conditions may be ending, though early crossovers still carry high false-start risk until the slower lines slope in the same direction.
3. Eating (Lines Fanned Out and Parallel)
During a healthy, sustained trend, all three lines angle sharply upward or downward with widening separation between them:
Uptrend alignment: Green Lips on top, red Teeth in the middle, blue Jaw on the bottom, with price holding above the Lips.
Downtrend alignment: Green Lips on the bottom, red Teeth in the middle, blue Jaw on the top, with price holding below the Lips.
In this phase, pullbacks often test the green Lips or red Teeth without breaking the blue Jaw, showing that directional momentum remains intact.
4. Sated (Lines Converging)
No trend runs forever. As directional momentum fades and profit-taking sets in, the green Lips flatten out and curve back toward the red Teeth and blue Jaw. When the Lips cross back over the Teeth, the trend phase is losing structure: signaling that the market is either entering a deeper pullback or returning to a sideways sleeping phase.
How the Alligator Indicator Fits Prop Firm Constraints
Inside a funded account, the Alligator works best as a session and regime filter that tells you when to stay flat: not as a standalone buy-or-sell trigger.
Retail tutorials often treat every green-over-red crossover as an automatic trade signal. In a personal brokerage account with no daily loss ceiling, surviving four small stop-outs while waiting for one big trend is mildly annoying. Inside a prop firm challenge, those same four stop-outs can end your evaluation before the real move ever starts.
Using the indicator effectively under funded-account rules comes down to three practical habits:
Enforcing a "no-trade" rule during sleeping phases: Most evaluation failures stem from overtrading low-volatility hours. If the Jaw, Teeth, and Lips are flat and tangled on your primary execution timeframe, stepping away from the screen preserves your daily drawdown buffer for sessions with real volume.
Checking higher-timeframe alignment first: Before taking an intraday setup on a 5-minute or 15-minute chart, check whether the 1-hour or 4-hour Alligator is fanned out and sloping in your intended direction. Trading intraday pullbacks in the direction of a higher-timeframe "eating" phase avoids fighting dominant order flow.
Keeping position sizing completely independent: The Alligator shows trend state, not stop-loss distance or account risk. Whether the lines are tightly wound or wide apart, calculate your lot size strictly from your invalidation level and hard dollar risk cap per trade (such as 0.5% of starting account balance).
Combining the Alligator With Other Trend and Momentum Tools
Because the Alligator relies purely on smoothed price averages, pairing it with an independent timing or structural filter helps you avoid false breakouts before risking challenge equity.
All moving-average systems share a blind spot: they measure smoothed past prices, so they react slowly when volatility abruptly expands or stalls. Combining the Alligator with a non-correlated confirmation tool gives you a clearer read on whether a breakout has genuine participation behind it:
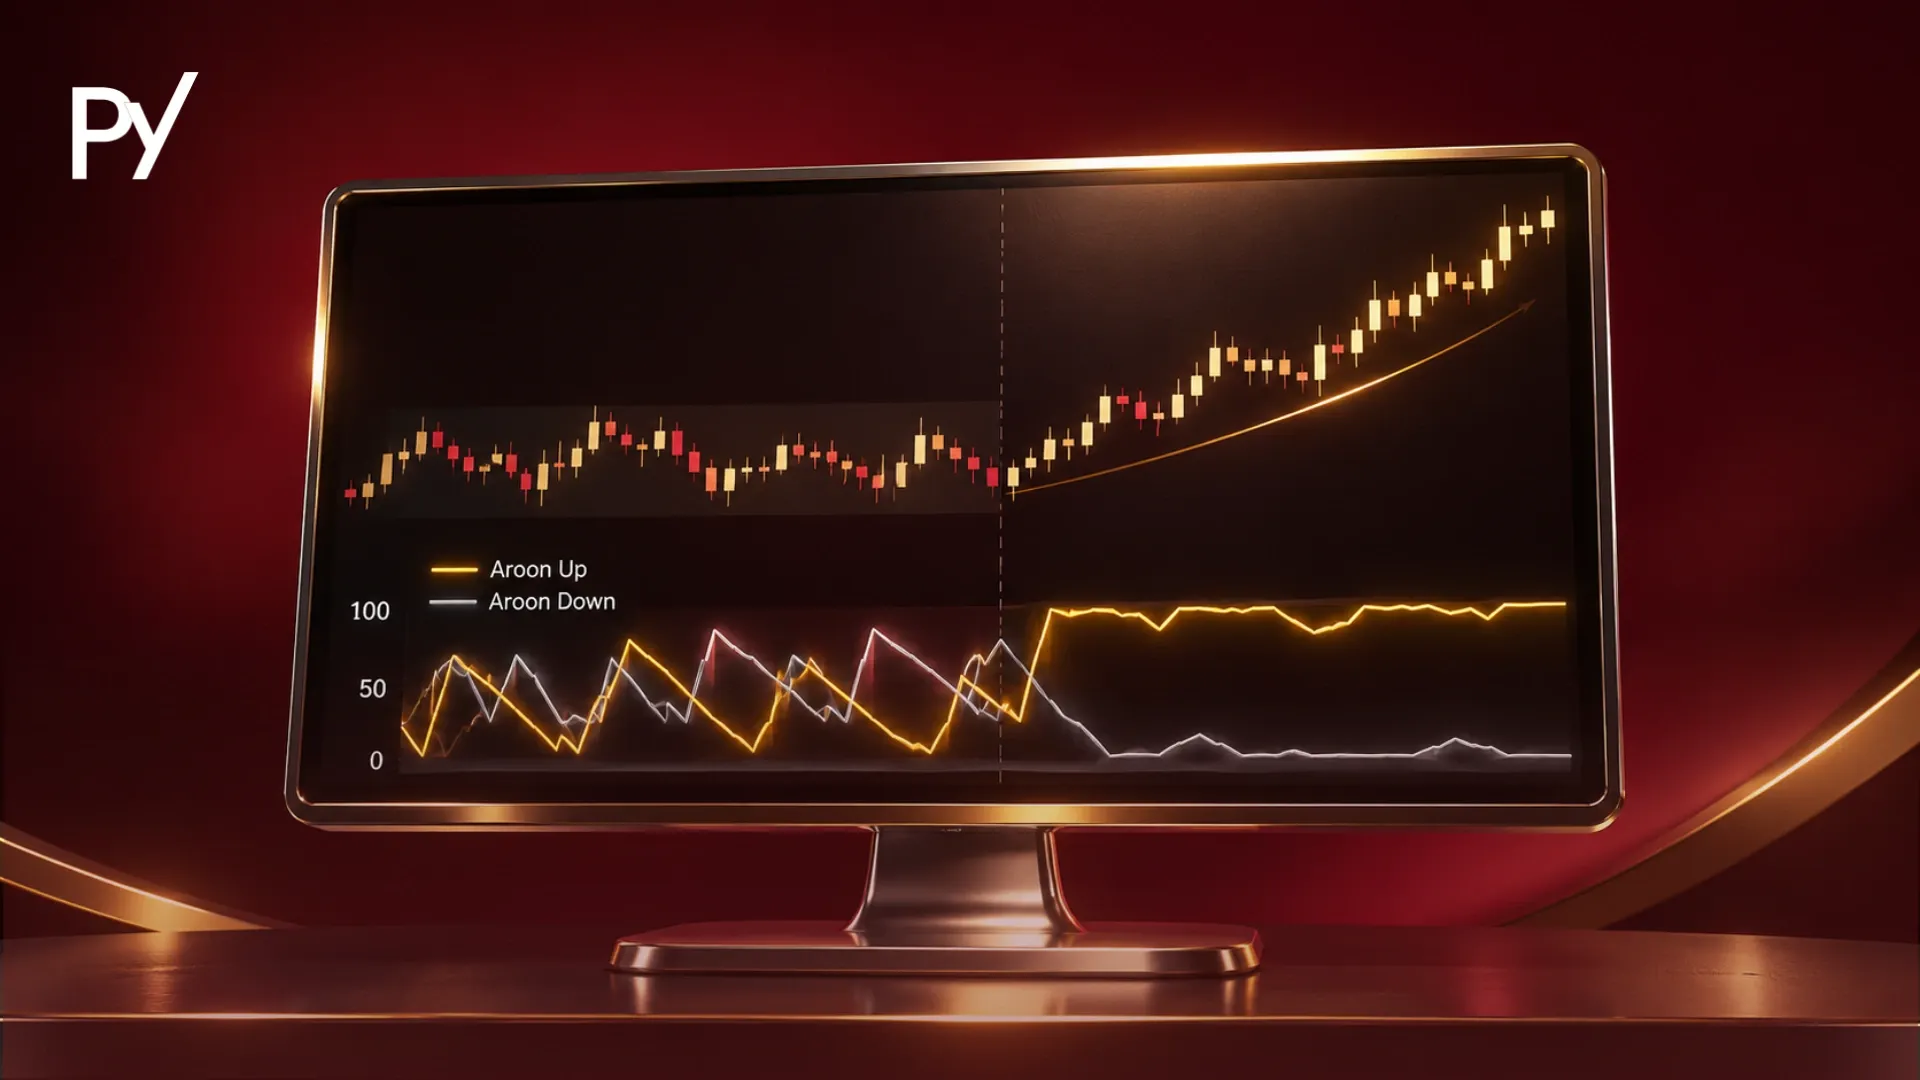
Time-based trend measurement: Because the Alligator tracks smoothed price averages, pairing it with an oscillator like the aroon indicator (which measures how recently price hit a period high or low) helps you verify whether directional momentum is genuinely fresh or already stalling before you risk challenge equity.
Market structure and fractals: Williams originally paired the Alligator with Fractals (five-bar swing highs and lows) so traders wouldn't act on a line crossover until price actually broke above or below a confirmed structural swing point outside the Alligator's teeth.
Session volume or volatility checks: Confirming that an awakening phase coincides with major session opens (such as London or New York equity market opens) reduces the odds of getting trapped in a low-liquidity fakeout.
3 Alligator Indicator Traps That Blow Funded Challenges
Treating the Alligator as a mechanical crossover system inside a prop firm account exposes you to three structural rule traps that standard retail tutorials ignore.
1. The Trailing Drawdown Lag Trap
Because the Jaw, Teeth, and Lips are smoothed and shifted forward by 8, 5, and 3 bars, exit signals arrive late. If you ride a strong trend up $2,500 in unrealized profit and wait for the green Lips to cross back below the red Teeth before closing, price may retrace 35% to 50% of the move before the indicator confirms momentum has stalled. At firms that calculate an equity-based trailing drawdown from your highest open equity peak, giving back $1,200 of floating profit while waiting for a lagging crossover can breach your maximum loss limit: even while your trade is still technically green.
2. Whipsaw Bleeds in "Sleeping" Markets
Markets spend most of their time consolidating. If you enter every time the green Lips nudge above or below the red Teeth while all three lines are horizontal, you'll get stopped out repeatedly as price oscillates around the mean. Five consecutive 0.8% losses (plus spread and commission drag) will wipe out a typical 4% to 5% daily loss cap in a single afternoon.
3. Consistency Rule Friction and EA Restrictions
Paradoxically, catching a massive trend right after a long sleeping phase can create a rule problem at firms that enforce a consistency rule: where no single trading day is allowed to exceed a set share (often 20% to 40%) of your total challenge profits. Making 80% of your profit target on one runaway trend day won't necessarily fail your account, but it can force you to keep trading just to dilute that single-day spike, exposing your gains to fresh drawdown risk. Additionally, if you rely on automated MetaTrader Expert Advisors (EAs) built around Alligator crossovers, verify your firm's rulebook first: many firms restrict third-party bots or flag identical signal execution across multiple accounts.
The Alligator indicator gives you a visual framework for separating trend expansion from sideways chop, making it far more useful as a patience filter than a standalone entry signal. When the 13-, 8-, and 5-period Smoothed Moving Averages intertwine, stepping aside protects your daily loss limit from whipsaw bleeds. When the lines fan out cleanly, pairing that directional bias with strict per-trade risk limits and proactive profit management keeps forward-shift lag from threatening your trailing drawdown. To see how trend-following filters fit alongside momentum oscillators, volatility bands, and volume tools inside a funded trading plan, explore our complete guide to technical indicators.
Disclaimer: This guide was written with AI assistance, reviewed for accuracy by the Proptary editorial team, and kept up to date. It's for education only — not financial advice. Prop trading and the financial markets carry a significant risk of loss, so consider your own situation and consult a licensed advisor before you trade.
Disclaimer
This guide was written with AI assistance, reviewed for accuracy by the Proptary editorial team, and kept up to date. It’s for education only, not financial advice. Prop trading and the derivatives markets carry a significant risk of loss, and past performance is not a guarantee of future results. Consider your own situation and consult a licensed advisor before you trade.
Proptary editorial team independently reviews prop trading firms, verifies payouts, and explains the rules that decide who keeps an account. We disclose affiliate relationships and publish methodology for every score.