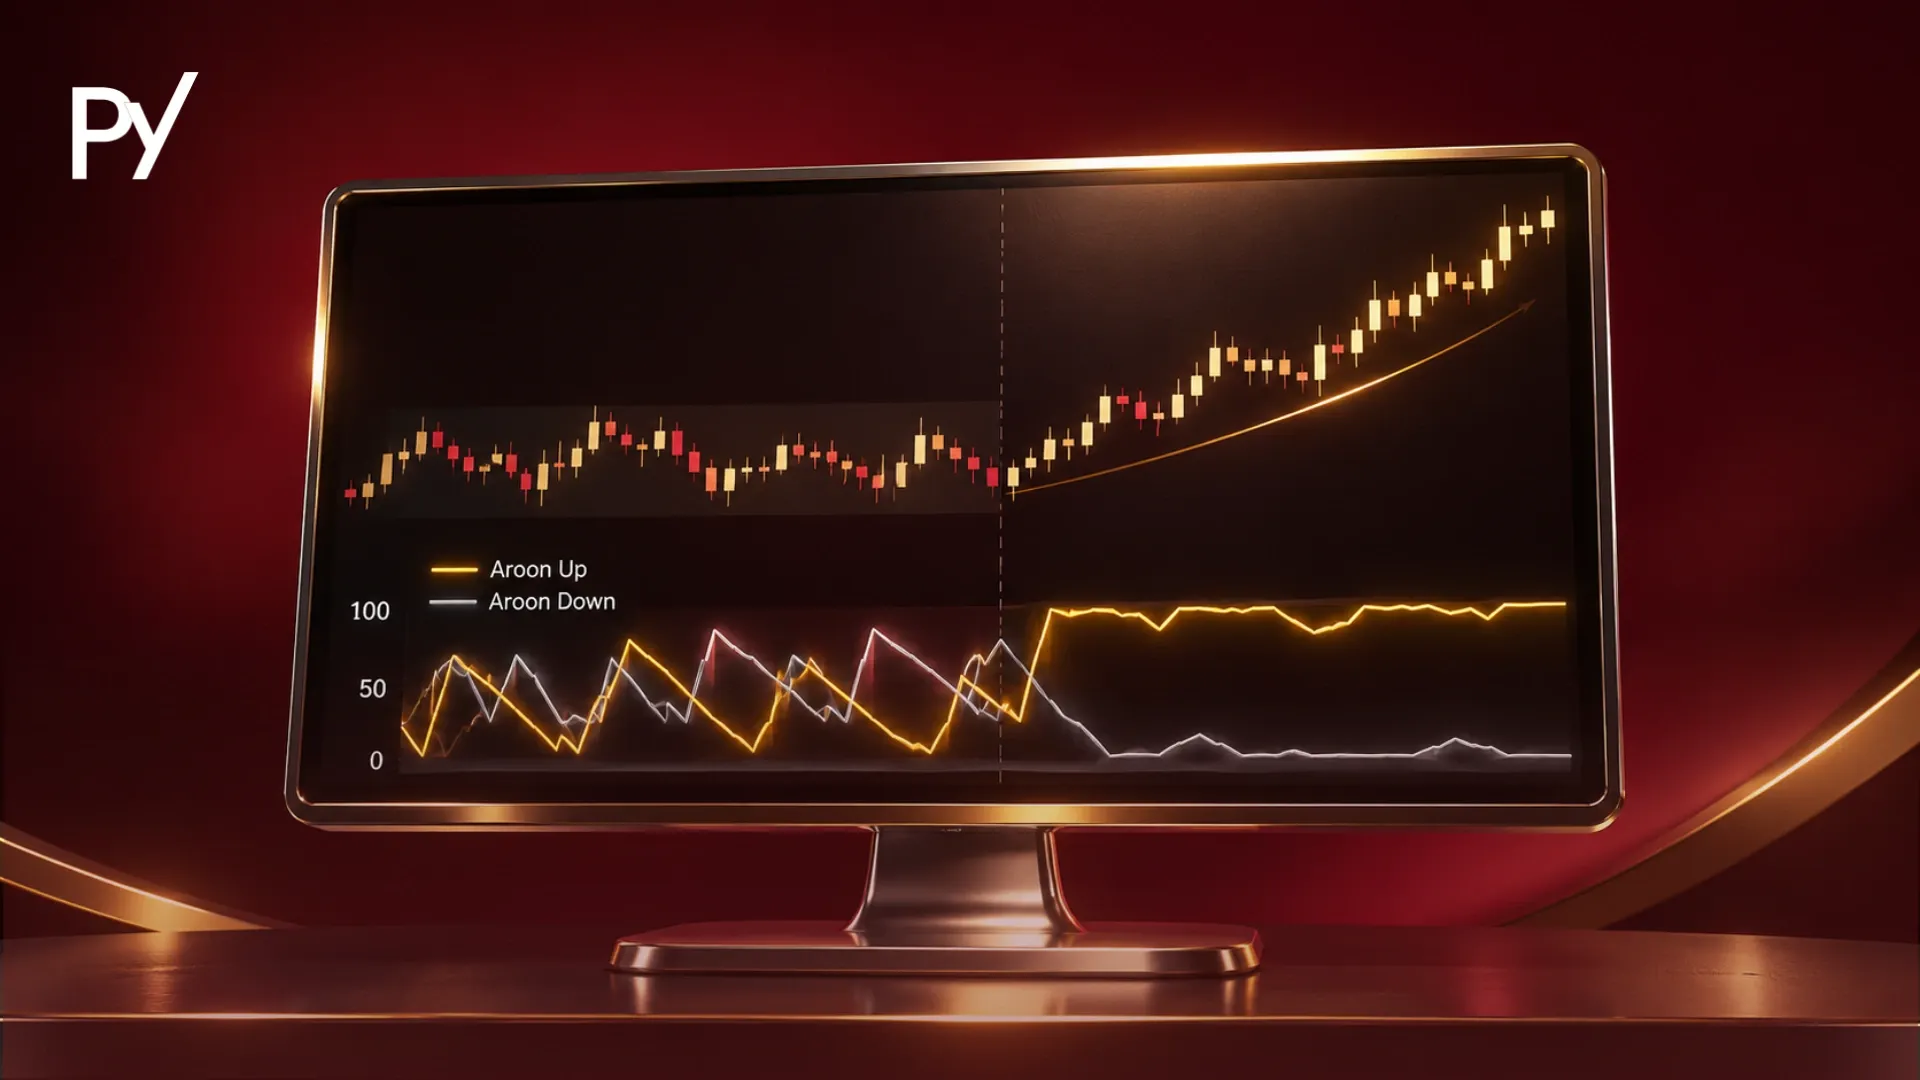
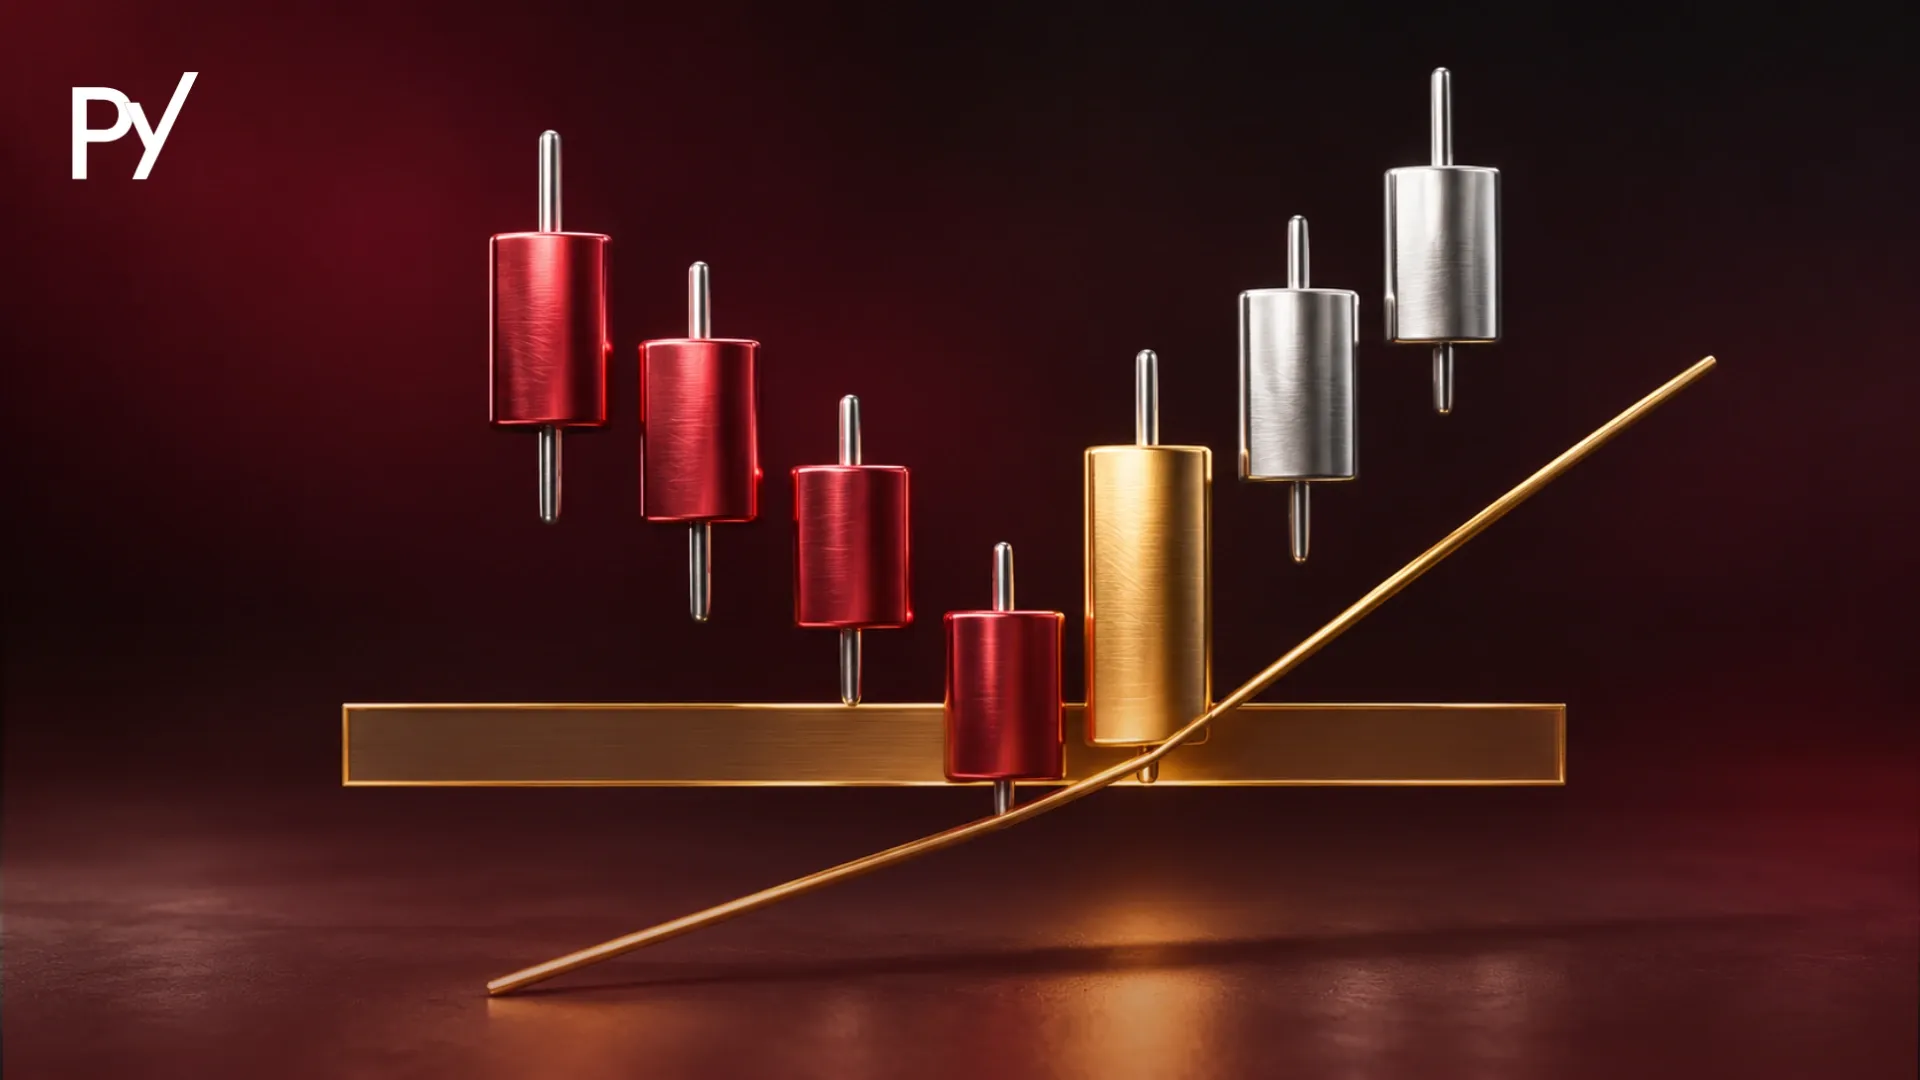
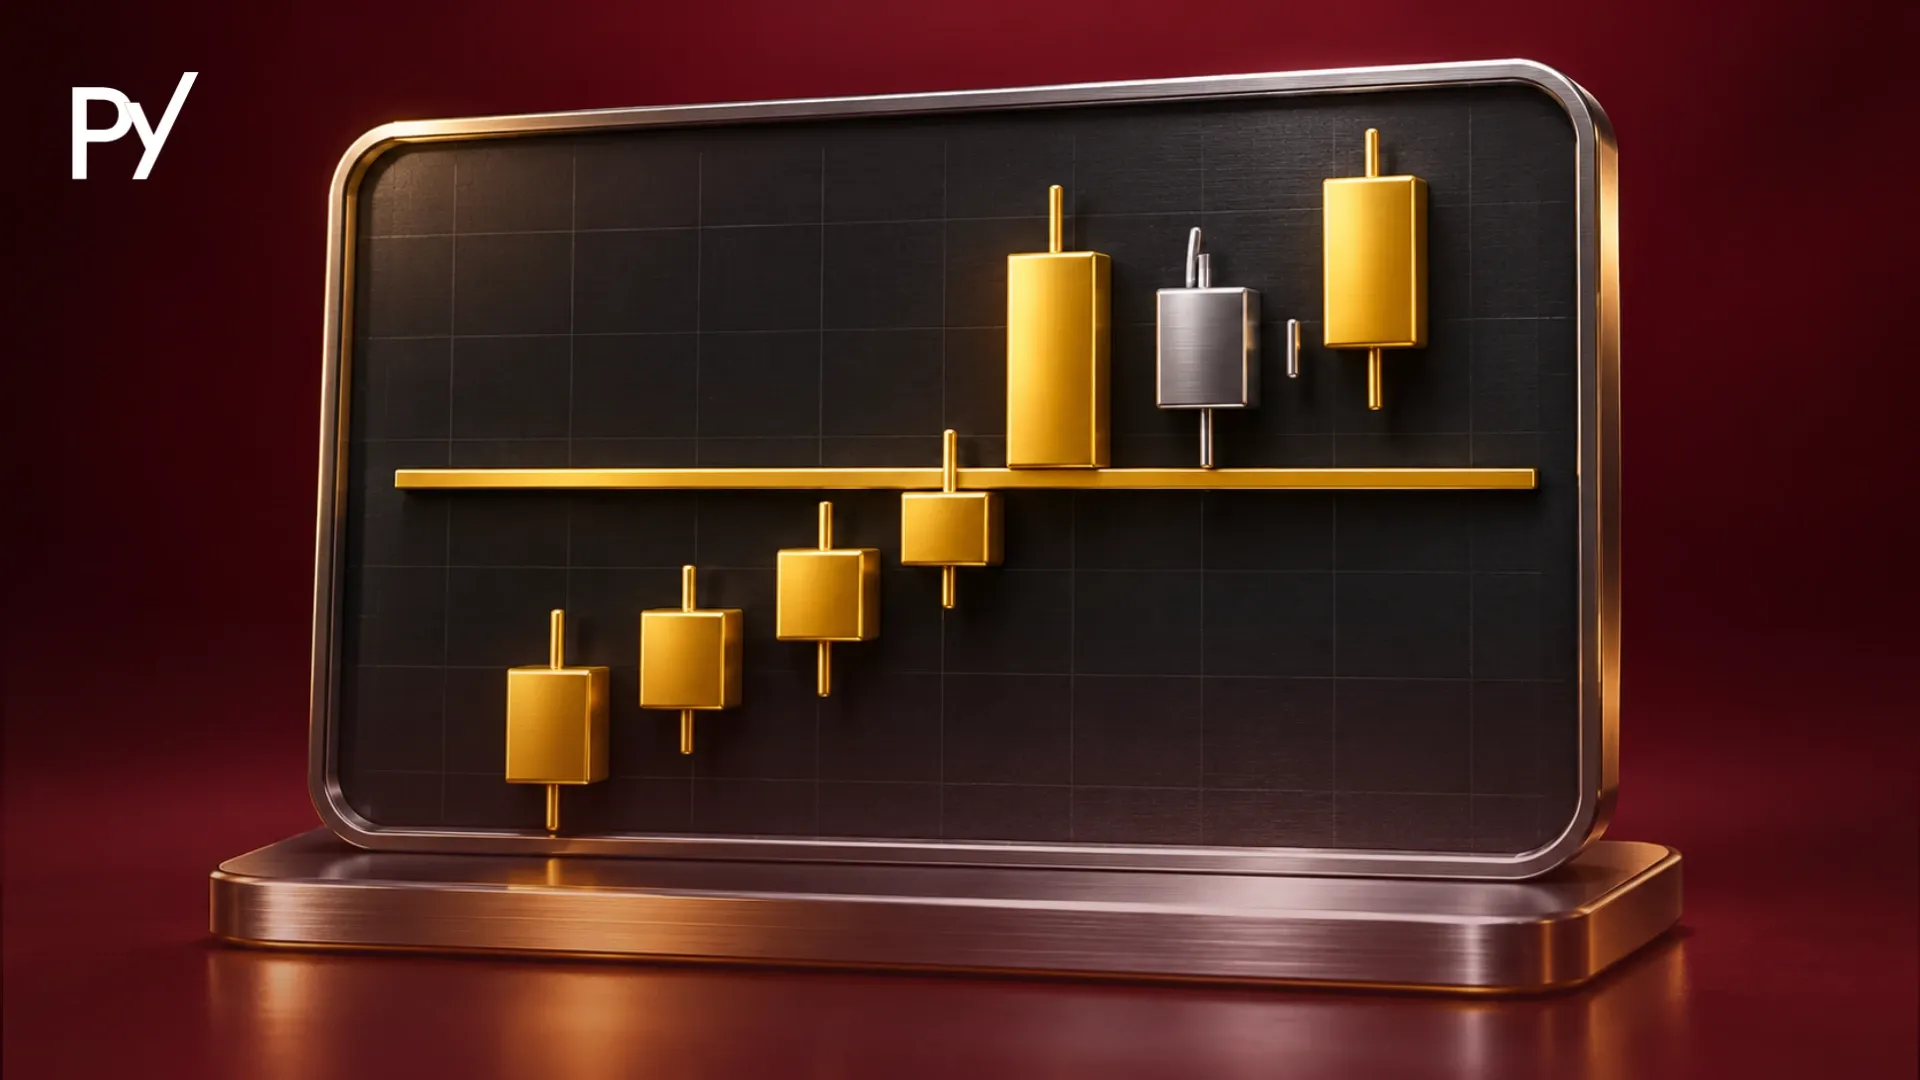
Displacement in trading is a sudden, forceful, one-sided price move driven by heavy order-flow imbalance that breaks beyond a prior swing high or low. It usually shows as one to three full-bodied candles that leave an unfilled Fair Value Gap. For funded traders, it helps confirm real structure shifts without chasing wide candles at their close.
Displacement in trading is a sudden, forceful, one-sided price move driven by heavy order-flow imbalance that breaks cleanly through a key structural level on a chart.
If you trade a funded account, you've likely watched a massive candle smash through resistance, jumped in at the close out of fear of missing the move, and watched a routine pullback wipe out half your daily loss limit before price finally went your way. Wide candles distort stop-loss math fast. This guide breaks down how to spot genuine displacement, separate it from news-driven traps, and size entries inside strict prop-firm drawdown limits.
What Is Displacement in Trading Meaning and Price-Action Anatomy?
Displacement in trading meaning comes down to clear directional conviction: instead of grinding slowly through a price level with overlapping candles, the market reprices aggressively in one direction because buy or sell demand far outweighs available liquidity on the other side.
Popularized within Smart Money Concepts (SMC) and Inner Circle Trader (ICT) frameworks, displacement is an objective price-action observation rather than a magic signal. Even when a move looks textbook, price can still stall or reverse if higher-timeframe supply absorbs the burst. With displacement in trading explained through its three visual traits, you can separate true expansion from routine chart noise:
Full-bodied candles with minimal wicks: A displacement leg usually consists of one to three consecutive large-range candles where the bodies account for most of the total range. Long wicks on both ends signal two-sided battle and hesitation, not displacement.
Decisive closes beyond structure: Rather than poking briefly past a prior swing high or low and snapping back inside the range, the displacement candle closes cleanly beyond the level, confirming that aggressive participants held control into the bar's close.
An unfilled Fair Value Gap (FVG): Because price moves too quickly for two-sided orders to match evenly, the middle candle in a three-candle displacement sequence typically leaves a visible gap between the first candle's high and the third candle's low (in a bullish move), or vice versa in a bearish move.
Consider a clean bullish example on an intraday index chart. Suppose price has spent two hours oscillating below a session high, building resting buy stops above that level. Suddenly, two consecutive full-bodied bullish candles surge through the high, close near their upper extremes, and leave a clear Fair Value Gap behind. Bearish displacement mirrors this in reverse: consecutive full-bodied red candles slice through a swing low, close near their lows, and leave an unfilled gap above.
How Does Displacement Confirm a Shift in Market Structure?
Displacement acts as the momentum confirmation that separates a genuine change in trend direction from a temporary liquidity sweep.
When price probes above an old swing high or below an old swing low, it triggers two groups of orders: stop-loss orders from traders positioned on the wrong side, and breakout entries from traders chasing the move. If large sellers use that cluster of buy orders to fill short positions, price quickly reverses back inside the prior range: a classic fakeout. Displacement happens when the opposite occurs: aggressive buyers absorb every available offer at the breakout level and keep pushing price higher, forcing short sellers to cover and leaving unfilled limit bids behind.
In market structure trading, that forceful close beyond a prior swing point confirms either a Break of Structure (BOS) in the direction of an existing trend or a Market Structure Shift (MSS) when a trend reverses. Without displacement, a structural break rests on weak participation and carries a much higher risk of snapping back against your position.
Displacement vs. Routine Breakouts vs. Economic News Spikes
Not every fast candle represents healthy order-flow expansion, and confusing organic displacement with a news spike can cost you a funded account in seconds.
Characteristic
Genuine Structural Displacement
Routine / Low-Momentum Breakout
High-Impact News Spike (CPI, NFP, FOMC)
Candle Anatomy
1–3 full-bodied candles; tiny wicks; closes near candle high or low
Small, overlapping bodies; frequent upper and lower wicks
Single extreme vertical bar or immediate two-way whip with long wicks
Order-Flow Driver
Sustained institutional or session-driven directional imbalance
Gradual retail drift or low-volume creep past a level
Liquidity providers pulling quotes ahead of scheduled data releases
Structural Impact
Clean close past a key swing level plus a clear Fair Value Gap
Marginal close past structure; prone to drifting back into range
Often sweeps both sides of a range before choosing a real direction
Funded-Account Risk
Wide initial stop if chased; manageable if entered on a pullback
High chop risk; frequent small stop-outs erode daily loss buffer
Severe slippage, widened spreads, and potential prop-firm rule breach
Routine breakouts often look tempting during quiet mid-session hours, yet they lack the order-flow urgency needed to clear nearby resistance cleanly. High-impact economic releases create the opposite problem: at the exact second tier-1 data drops, liquidity providers widen spreads or temporarily pull resting orders. Price can jump 40 or 50 points through thin air, printing a candle that looks identical to displacement on a standard chart before reversing just as violently two seconds later.
For funded traders, news-driven candles carry a double hazard. First, market orders executed during widened spreads suffer heavy slippage, turning a planned 0.5% loss into a 1.5% hit before you can react. Second, many prop firms restrict opening or closing trades within a two-to-five-minute window around major economic releases. Even if you read the direction right, catching a news spike can breach your firm's rulebook and void challenge progress or funded profits.
Why Displacement Matters Inside a Funded Account
On a challenge or funded account, displacement's biggest impact isn't predicting where price will go next: it's how expanded candle ranges compress your stop-loss and position-sizing math.
Most prop firms enforce strict loss ceilings, commonly capping daily drawdown between 4% and 5% of starting or prior-day equity and maximum overall drawdown between 8% and 10%. When a market prints a clean displacement leg, the distance from the candle's close back to the logical invalidation point (the swing low or high where the move began) is often two to three times wider than your normal stop distance.
Consider an illustrative sizing example on a $100,000 funded account with a 5% ($5,000) daily loss limit and a personal risk cap of 0.5% ($500) per trade. Suppose your normal stop-loss is 10 points, allowing you to trade 5 contracts at $10 per point. Now a bullish displacement leg surges 30 points in two candles. If you buy the close and place your protective stop below the displacement origin 30 points away, keeping your $500 risk cap forces you to cut size to 1.6 contracts (or 1 standard contract), slashing your potential payout if price only travels another 30 points. Conversely, if you keep your usual 5-contract size on that 30-point stop, a normal pullback stops you out for $1,500: wiping out 30% of your entire daily loss limit on a single impulsive click.
This is a hypothetical sizing illustration, not historical performance data, and real-world slippage can make the actual loss even larger. The takeaway for funded traders is straightforward: displacement tells you where momentum shifted, not where to hit the market button.
How to Trade Displacement Without Chasing the Move
Disciplined funded traders treat displacement as a directional filter that sets up a patient pullback entry, never as a signal to chase price at the extreme.
Verify the structural close and check the economic calendar: Confirm that the displacement candle closed cleanly beyond a prior swing high or low and left an unfilled imbalance. Before marking any zone, check that the move didn't occur during a restricted high-impact news window.
Map the Fair Value Gap and broken structural zone: Highlight the Fair Value Gap created by the displacement candles alongside the prior swing level that just broke. In strong directional shifts, these overlapping zones often attract resting limit orders when early profit-taking triggers a pullback.
Wait for price to return to the zone: Let price pull back into the imbalance rather than chasing the initial surge. Understanding what is a retest in trading helps you judge whether the broken level is holding as new support or resistance, while letting you anchor a tighter stop-loss just beyond the Fair Value Gap or structural swing instead of across the entire expansion leg.
Calculate position size from invalidation before entry: Measure the exact distance from your planned retest entry to your stop-loss level, then size your contracts or lots so a loss stays strictly inside your pre-set fraction of daily drawdown: typically 0.25% to 0.5% on a funded account. If price never pulls back and runs without you, skip the trade and wait for the next clean setup.
Common Displacement Mistakes That Blow Prop Firm Challenges
Even when you spot genuine displacement on the chart, three recurring execution habits can turn a high-probability structural read into a failed evaluation.
FOMO-chasing the displacement close: Entering right as a massive candle finishes printing puts you at the exact point where short-term participants take partial profits. Absorbing a routine 50% pullback on full size eats directly into tight daily drawdown limits: and on accounts with equity-based trailing drawdown, an unrealized spike followed by a pullback can permanently lock your loss floor higher.
Ignoring failed displacement and bull or bear traps: Displacement is a probabilistic clue, not a guarantee of trend continuation. If price displaces above a swing high, fails to hold on the retest, and closes back below the origin of the move, the market has completed a liquidity sweep rather than a sustained shift. Refusing to cut the trade when invalidation breaks turns a controlled 0.5% loss into a blown account.
Over-sizing because a setup "looks obvious": Full-bodied candles create strong visual conviction, tempting traders to double their normal lot size because institutional momentum appears unmistakable. When combined with high leverage and unexpected session volatility, a single failed displacement setup can breach a daily loss limit before your stop-loss finishes filling.
Conclusion
Displacement in trading marks a decisive imbalance between buyers and sellers, confirmed by full-bodied candles, a clean close beyond market structure, and an accompanying Fair Value Gap. Inside a funded account, its real value lies in filtering out choppy ranges and keeping you patient: because chasing the close of an expanded candle breaks your stop-loss math and exposes your daily drawdown to routine pullbacks. By separating organic structural shifts from news-driven volatility and waiting for controlled retests sized to your risk limit, you protect your account first and let momentum work in your favor. Once you can spot true displacement on a chart, the next step is mapping how those impulsive moves fit into the broader trend: explore our complete guide to market structure trading to connect structural shifts, liquidity, and funded-account risk rules.
Disclaimer: This guide was written with AI assistance, reviewed for accuracy by the Proptary editorial team, and kept up to date. It's for education only — not financial advice. Prop trading and the financial markets carry a significant risk of loss, so consider your own situation and consult a licensed advisor before you trade.
FAQ
What is the relationship between displacement and a Fair Value Gap?
A Fair Value Gap is a three-candle price imbalance created directly by displacement. When aggressive buying or selling pushes price rapidly in one direction, two-sided orders cannot match evenly at every price level, leaving a gap between the first candle's wick and the third candle's wick. Traders mark this unfilled zone as a potential pullback area because resting limit orders often sit there waiting to be filled.
Why does displacement sometimes fail and turn into a fakeout?
Displacement fails when large counterparties use the burst of breakout orders above a swing high or below a swing low to fill opposing positions. Instead of continuing in the breakout direction, price snaps back inside the prior range and closes beyond the origin of the move. In a funded account, this bull or bear trap makes honoring your stop-loss essential so a single failed shift does not threaten your daily loss limit.
Which timeframes work best for spotting displacement in trading?
Displacement occurs across all timeframes, from one-minute intraday charts to daily swing charts, because order-flow imbalances happen at every scale. However, higher timeframes such as the fifteen-minute, one-hour, and four-hour charts generally filter out routine session noise and produce cleaner structural breaks. Many funded traders identify displacement on a higher timeframe to set directional bias, then drop to a lower timeframe to refine their pullback entry and stop distance.
Does displacement require high volume to be valid?
In centralized markets like futures, genuine displacement typically aligns with a noticeable surge in traded volume, confirming active participation behind the price expansion. In decentralized markets like spot forex or CFDs, where centralized volume is unavailable, tick volume usually spikes alongside wide candle bodies. Either way, volume alone is secondary to price-action confirmation—the candles must still close decisively beyond a key structural level rather than leaving long rejection wicks.
How is displacement different from a standard liquidity sweep?
A liquidity sweep briefly pokes beyond an old swing high or low to trigger resting stop orders, then quickly reverses and closes back inside the prior range with a long wick. Displacement does the opposite by closing full-bodied candles decisively beyond that structural level and maintaining momentum in the new direction. Often, a liquidity sweep occurs first in one direction, followed immediately by displacement in the opposite direction.
Disclaimer
This guide was written with AI assistance, reviewed for accuracy by the Proptary editorial team, and kept up to date. It’s for education only, not financial advice. Prop trading and the derivatives markets carry a significant risk of loss, and past performance is not a guarantee of future results. Consider your own situation and consult a licensed advisor before you trade.
Proptary editorial team independently reviews prop trading firms, verifies payouts, and explains the rules that decide who keeps an account. We disclose affiliate relationships and publish methodology for every score.