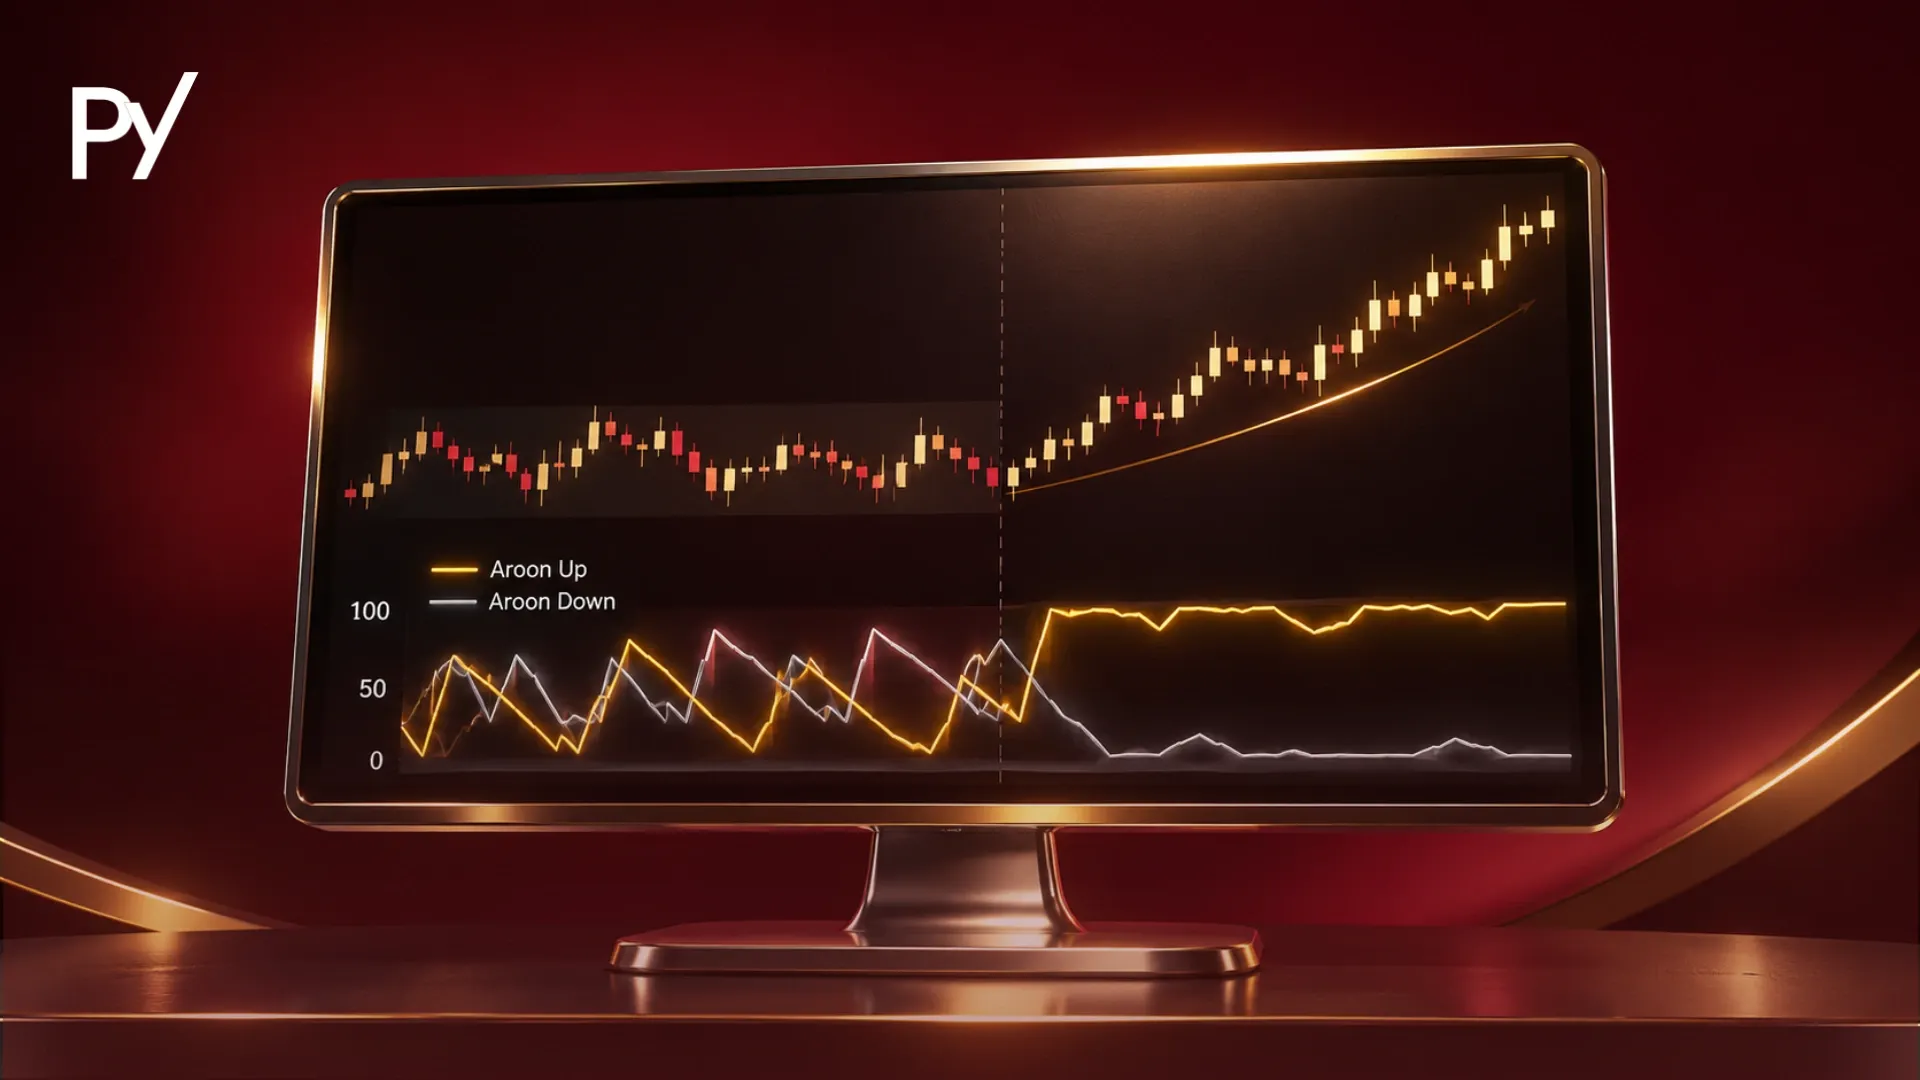
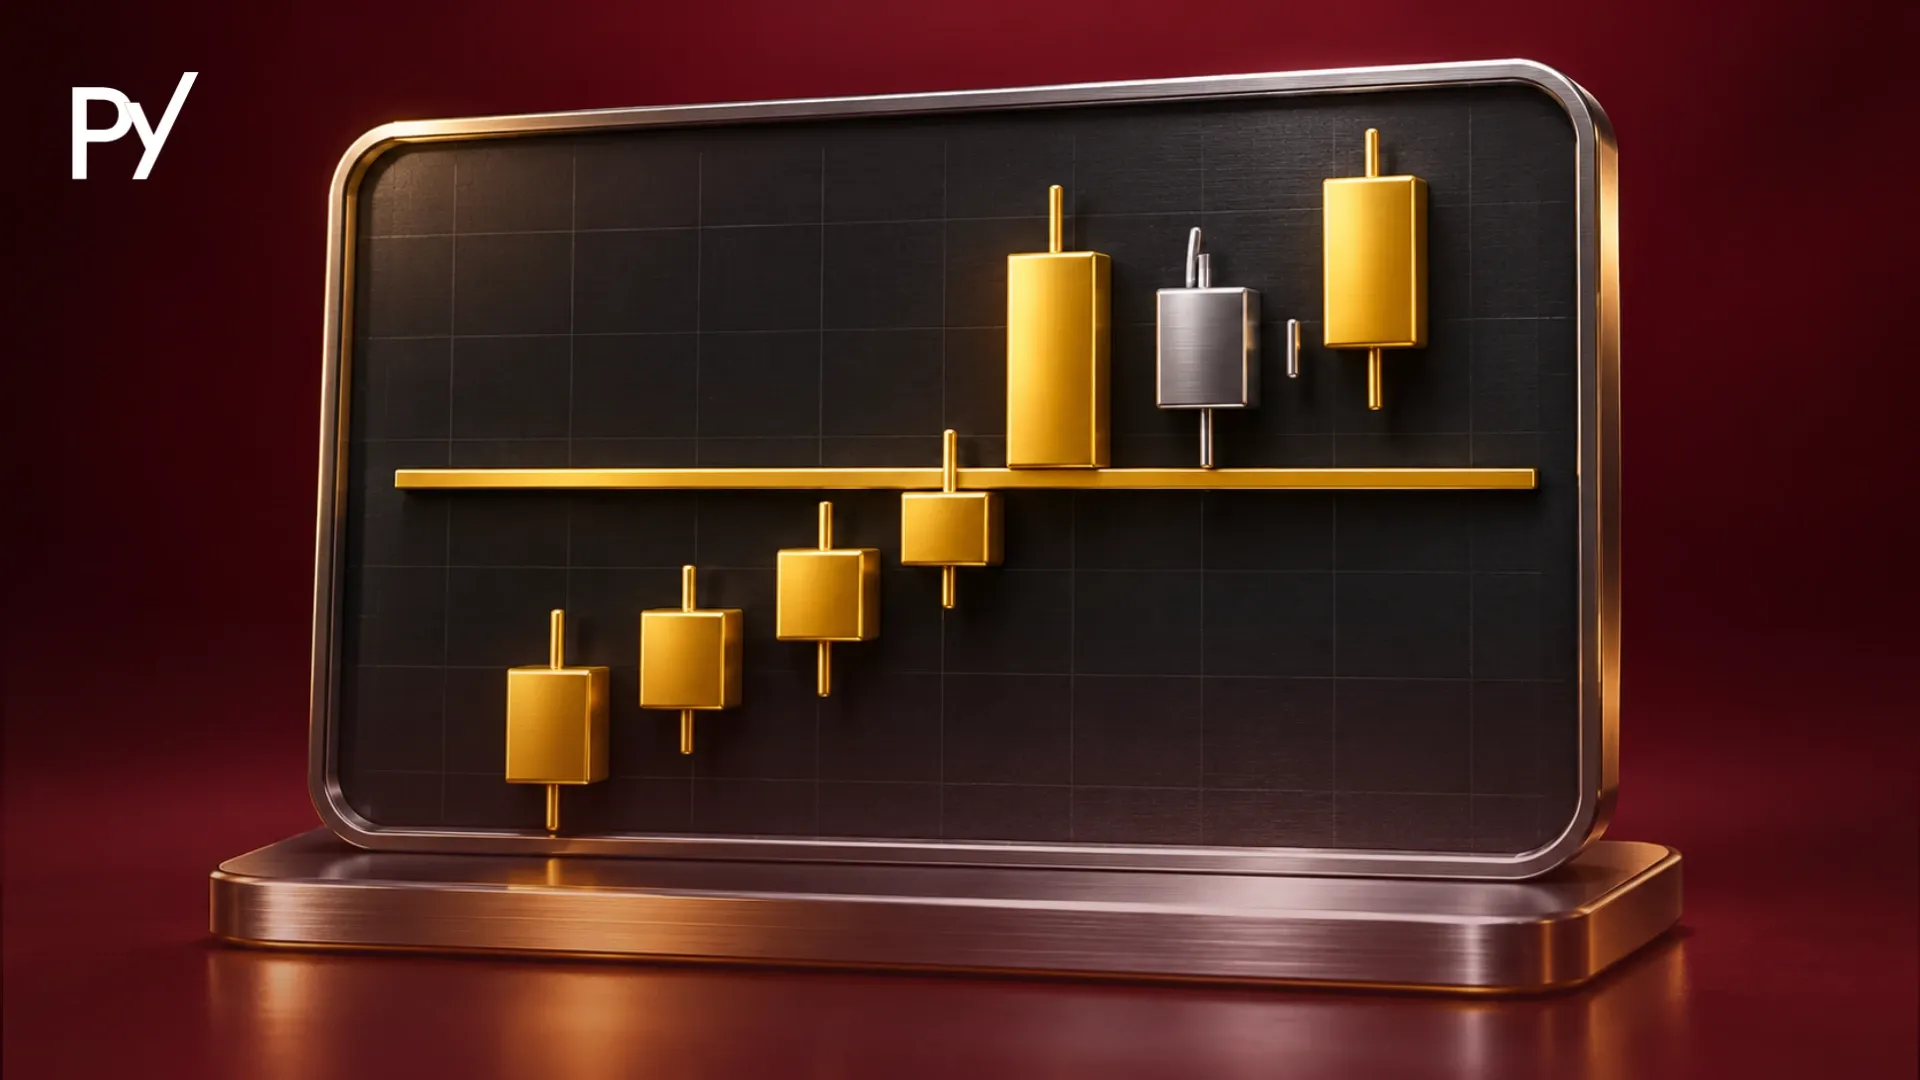
Confluence in trading is the alignment of two or more independent technical factors, such as higher-timeframe structure, a support or resistance zone, and a candlestick trigger, at the same price area. It filters out low-probability trades and defines a clear stop-loss boundary. In a funded account, it is a probability filter, not a guarantee, so consistent sizing still matters.
Confluence in trading is the alignment of two or more independent technical factors (such as higher-timeframe trend structure, a horizontal price level, and a candlestick trigger) at the exact same price zone.
If you have ever failed a prop firm evaluation after taking three rapid, single-indicator impulse trades before lunch, you already know how expensive isolated signals can be. Inside a funded account with strict daily loss limits, filtering out low-grade setups matters more than catching every move. This guide breaks down confluence in trading explained through a three-layer checklist, real chart mechanics, and the four traps that still blow funded accounts.
What Does Confluence Mean in Trading?
Confluence in trading means multiple separate technical clues point to the same buy or sell area on your chart at the same time. The term comes from geography, where two or more distinct rivers flow together to form a stronger, deeper current. On a price chart, each independent factor represents a different group of market participants watching the same price zone: not an exact single tick, but a defined area where orders are likely to cluster.
Understanding confluence in trading meaning starts with separating three terms that traders often mix up:
Confluence is the overlap of independent factors at one location: for example, a prior resistance zone aligning with a rising 50-period moving average and a 50% retracement.
Convergence happens when two related lines move closer together over time, such as a fast moving average crossing above a slow moving average.
Confirmation is the real-time price reaction after price reaches your confluence zone, such as a strong rejection close that proves buyers or sellers are actually defending the level.
Raw market structure anchors every reliable confluence zone. When you build your chart from clean swing highs, swing lows, and historical supply or demand zones through price action trading, secondary tools like moving averages or Fibonacci levels simply verify whether institutional order flow is likely to step in at that same area.
How Confluence Works: The 3-Layer Framework
The cleanest way to apply confluence in trading explained in plain terms is to organize your chart analysis into three independent layers: Direction, Location, and Trigger. Requiring one clear input from each layer stops you from counting the same piece of price data twice and gives you an objective checklist before you risk funded capital.
Layer 1: Direction (Higher-Timeframe Context): Start on a higher timeframe, such as the 4-hour or 1-hour chart, to identify whether price is printing higher highs and higher lows (an uptrend) or lower highs and lower lows (a downtrend). Trading in the direction of higher-timeframe order flow keeps you from fading strong momentum just because a lower-timeframe indicator looks oversold.
Layer 2: Location (Overlapping Price Zone): Identify a structural area where at least two separate location tools overlap. Common pairings include a prior horizontal support or resistance level meeting a dynamic moving average (like the 50 EMA or session VWAP), or a clean order block intersecting a 50% to 61.8% Fibonacci pullback.
Layer 3: Trigger (Real-Time Execution Signal): Wait for price to enter your location zone and print an active response on your execution timeframe. A sharp rejection wick, an engulfing candle close, or a noticeable volume spike confirms that participants are defending the zone right now rather than slicing straight through it.
Factor Type
True Confluence (Independent Layers)
False Confluence (Redundant Stacking)
Data Source
Combines price structure, horizontal levels, and real-time candle reaction
Uses multiple oscillators derived from the exact same closing-price formula
Chart Example
4H uptrend + prior resistance turned support + 50 EMA + bullish rejection close
Gives a logical invalidation point just beyond the overlapping zone
Leaves stop-loss placement arbitrary because oscillators have no price boundary
Prop-Account Impact
Cuts low-probability impulse entries and preserves daily drawdown
Creates false confidence and encourages overtrading in choppy ranges
Why Confluence Matters Inside a Funded Account
Inside a funded account governed by strict daily loss limits and trailing drawdowns, confluence acts primarily as a trade-frequency filter that stops you from bleeding capital on mediocre setups. Unlike a personal retail account where a rough morning only dents your own balance, most two-step prop firm challenges enforce a daily loss cap around 4% to 5% and a maximum drawdown of 8% to 10%.
Consider a hypothetical $100,000 evaluation account with a $5,000 daily loss limit. Suppose you risk 0.5% ($500) per trade. If you take four isolated, single-indicator trades during a choppy London-to-New York overlap and all four fail, you are down $2,000 (2.0%) before the afternoon session even begins: leaving you dangerously close to a daily violation if volatility spikes.
Now apply a three-layer confluence filter to that same hypothetical $100,000 account. Because you require higher-timeframe structure, an overlapping horizontal level, and a candle trigger before clicking buy or sell, three of those four impulse trades never qualify. You take one structured setup with the same $500 (0.5%) risk cap, and your stop-loss sits cleanly beneath the entire confluence zone: where your trade thesis is objectively wrong.
Step-by-Step: How to Validate a Confluence Setup Before Entering
Validating a confluence setup works best as a top-down routine that locks in your risk before you ever place an order. Follow these four steps in order so you evaluate what the chart is actually doing instead of drawing lines to justify a trade you already want to take:
Map higher-timeframe structure first: Open your 4-hour or 1-hour chart and mark the most recent swing high, swing low, and active trend direction. Decide whether you are looking strictly for longs or shorts before zooming in.
Highlight the overlapping price zone: Mark the nearest clean horizontal support or resistance level, then check if a dynamic level (such as a 50 EMA or VWAP) or a key Fibonacci retracement intersects that same band. Draw a shaded box around the overlap rather than a razor-thin line.
Wait for price to enter the zone and print a trigger: Avoid setting blind limit orders on heavily watched levels. Let price trade into your shaded zone and print a clear rejection close or structure shift on your 15-minute or 5-minute execution chart.
Place your stop-loss beyond the zone and calculate size: Set your stop-loss just outside the far edge of the confluence box so normal price noise inside the zone does not stop you out early. Size your position strictly to your pre-set challenge risk cap (such as 0.5% to 1.0% of account equity) before entering.
Worked Hypothetical Setup Example
Imagine EUR/USD is printing clear higher highs and higher lows on the 4-hour chart (Layer 1: Direction). Price pulls back toward a prior resistance level at 1.0850 that now acts as support, and both the 1-hour 50 EMA and the 50% Fibonacci retracement of the prior impulse leg sit between 1.0845 and 1.0855 (Layer 2: Location).
Instead of buying the first touch, you wait until price dips to 1.0847 and closes a 15-minute bullish engulfing candle back above 1.0855 (Layer 3: Trigger). You enter long at 1.0856 with a stop-loss at 1.0836 (20 pips, safely below the 1.0845 zone floor) and target the prior swing high at 1.0896 (40 pips), giving you a clean 1:2 risk-to-reward ratio on a hypothetical setup where every factor has a distinct job.
4 Confluence Traps That Blow Funded Accounts
Misunderstanding confluence in trading creates predictable behavioral traps that can fail an evaluation even when your chart markup looks textbook. Watch for these four mistakes every time you build a trade plan:
1. The Correlated-Indicator Illusion (Multicollinearity)
Stacking three momentum oscillators (such as RSI, MACD, and Stochastic) at the same price level is not confluence. All three indicators calculate momentum from the exact same closing-price history, meaning you are counting one signal three times. True confluence pairs genuinely independent dimensions of market behavior, such as horizontal price structure, dynamic trend support, and volume or candlestick confirmation.
2. Over-Sizing Because "Everything Lines Up"
The fastest way to violate a prop firm's daily loss limit is to double or triple your normal lot size because a setup shows four or five overlapping signals. Confluence improves your trade selection, not your immunity to sudden market reversals. Even an "A+" confluence zone will fail immediately if an unscheduled central bank headline or liquidity sweep hits the tape, and an oversized loss on a single trade can erase a week of disciplined gains.
3. Entering Crowded Zones Without Confirmation
When a horizontal level, trendline, and moving average line up too obviously, retail traders pile in with resting orders: and place their stop-losses right behind the exact same zone. Institutional liquidity often sweeps just past those crowded boundaries to trigger stops before reversing in the original direction. Understanding what is a bull trap helps you recognize why impatient traders who buy an unconfirmed breakout above resistance often get caught in a sudden reversal, and why waiting for a post-sweep close back inside your zone protects your capital.
4. Analysis Paralysis and Retrofitting
Demanding six or seven overlapping rules on every trade leaves you frozen on the sidelines while clean moves play out without you: often triggering frustration and late, chased entries with poor risk-to-reward. The opposite habit is just as dangerous: deciding you want to enter a trade first, then adding extra trendlines, minor Fibonacci ratios, or obscure moving averages until your chart appears to show "confluence." Stick to a fixed two-to-three-factor checklist and accept that some valid moves will pass without your criteria firing.
Conclusion
Confluence in trading gives you a repeatable way to filter out random chart noise by requiring two or three independent technical factors to align at the same price zone before you risk capital. Used properly, it sharpens your entry timing, anchors your stop-loss beyond a logical invalidation boundary, and curbs the overtrading that drains prop firm evaluations. Still, alignment never guarantees a winning trade: surviving drawdown rules depends on keeping your position size consistent and waiting for real-time confirmation rather than trusting crowded levels blindly. Once your confluence checklist is locked in, building deeper fluency in raw market structure through price action trading will make every zone you mark far easier to read.
Disclaimer: This guide was written with AI assistance, reviewed for accuracy by the Proptary editorial team, and kept up to date. It's for education only — not financial advice. Prop trading and the financial markets carry a significant risk of loss, so consider your own situation and consult a licensed advisor before you trade.
Disclaimer
This guide was written with AI assistance, reviewed for accuracy by the Proptary editorial team, and kept up to date. It’s for education only, not financial advice. Prop trading and the derivatives markets carry a significant risk of loss, and past performance is not a guarantee of future results. Consider your own situation and consult a licensed advisor before you trade.
Proptary editorial team independently reviews prop trading firms, verifies payouts, and explains the rules that decide who keeps an account. We disclose affiliate relationships and publish methodology for every score.