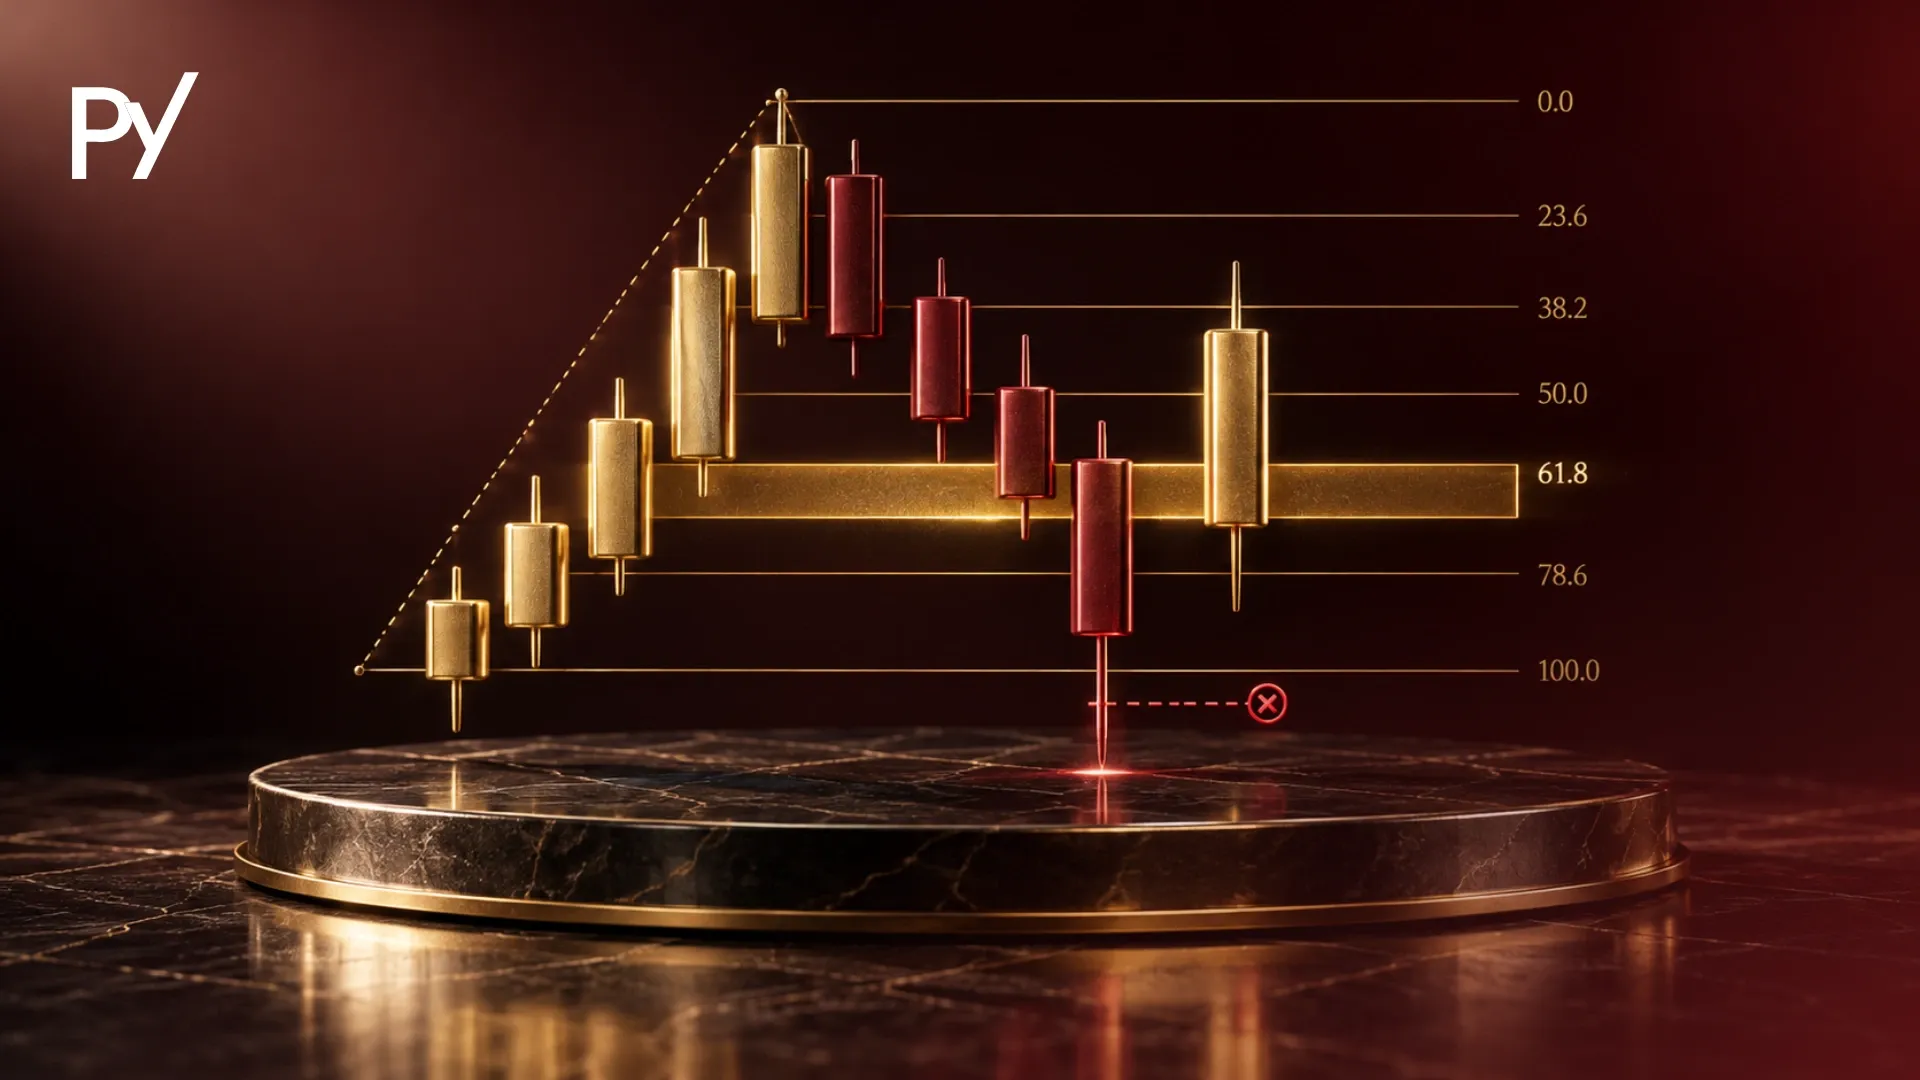
Elliott Wave Fibonacci analysis pairs Ralph Nelson Elliott's eight-wave structural market cycles with mathematical Golden Ratios to identify potential turning points and calculate extension targets. By anchoring wave pullbacks and impulses to specific Fibonacci levels (such as the 61.8% retracement and 161.8% extension), traders establish objective, mathematically defined invalidation boundaries.
Elliott Wave Fibonacci analysis combines Ralph Nelson Elliott's structural market cycle with Leonardo Fibonacci's mathematical ratios to forecast turning points, measure impulse extensions, and set objective price targets. It turns subjective chart patterns into precise, quantifiable market coordinates.
Most funded traders fail with wave theory because they treat wave counts as dogma, re-labeling charts as price moves against them until an unexpected drawdown breach liquidates the account. When you anchor wave structures to mathematical Fibonacci retracements and extensions, you replace speculative guesswork with defined invalidation boundaries. This guide covers how to align wave geometry with Fibonacci ratios to secure asymmetric risk-to-reward setups while safeguarding your funded capital.
What Is Elliott Wave Fibonacci Analysis?
Elliott Wave Fibonacci analysis is the application of mathematical Golden Ratios (primarily 38.2%, 50.0%, 61.8%, and 161.8%) to price waves to forecast turning zones and extension targets rather than relying on visual pattern guesswork. While classic Elliott Wave theory dictates where the market is within an 8-wave cycle (five motive waves followed by three corrective waves), Fibonacci mathematics gives you a way to estimate how far those waves may travel in price and time.
The synergy between the two concepts is foundational. Ralph Nelson Elliott identified that market trends unfold in fractal patterns driven by collective human psychology, but it was the number sequence that Leonardo Fibonacci introduced to Europe in 1202 (and that Indian mathematicians had described centuries earlier) that provided the recurring proportions between those swings. A wave count without Fibonacci ratios leaves more room for subjective interpretation, but Fibonacci levels do not remove that subjectivity: two analysts can label the same chart differently, so treat every count as a hypothesis. Conversely, Fibonacci retracement grids drawn in isolation lack the contextual roadmap of the broader market trend.
By integrating Elliott Wave Fibonacci analysis, you transform a theoretical forecasting model into an operational risk-management framework. You no longer ask, "What wave is this?" Instead, you ask, "Does this price swing conform to standard mathematical proportions, and where is the exact price level that proves my thesis wrong?" For traders managing simulated prop firm capital, that shift from prediction to risk definition is the difference between keeping an account and breaching a maximum daily loss limit.
Key Fibonacci Ratios Across Motive and Corrective Waves
Specific waves within the Elliott Wave cycle exhibit distinct mathematical tendencies that govern their depth, length, and internal structure. Knowing these standard ratios allows you to recognize when a wave structure is developing normally and when abnormal price behavior warns you to stay on the sidelines.
Motive Wave Relationships (Impulse Phase)
Motive waves drive the primary trend and consist of five distinct sub-waves labeled 1 through 5. Waves 1, 3, and 5 represent directional impulse, while Waves 2 and 4 represent counter-trend consolidations.
Wave 2 Retracements: Wave 2 typically retraces between 50.0% and 61.8% of Wave 1. In volatile markets, it can retrace as deeply as 78.6% or 88.6%. However, the absolute structural invalidation level is 100%: Wave 2 can never retrace more than the entire length of Wave 1 without terminating the impulse thesis entirely.
Wave 3 Projections: Wave 3 is almost never the shortest wave and is frequently the extended wave in equity indices. In commodity markets, the fifth wave is often the one that extends. It most commonly projects to 161.8% of the distance of Wave 1 measured from the base of Wave 2. In highly trending environments, Wave 3 frequently expands to 200% or 261.8% of Wave 1.
Wave 4 Pullbacks: Wave 4 typically produces a shallow, grinding consolidation that retraces 23.6% or 38.2% of Wave 3. Because Wave 4 is a corrective pullback following a powerful Wave 3 advance, it represents profit-taking rather than aggressive counter-trend selling. A hard structural rule is that Wave 4 cannot overlap the price territory of Wave 1 in a standard impulse.
Wave 5 Targets: When Wave 3 is extended, Wave 5 often equals the net distance of Wave 1 (100% relationship). Alternatively, Wave 5 frequently measures 61.8% of the total distance traveled from the start of Wave 1 to the terminal peak of Wave 3, projected from the end of Wave 4.
Corrective phases retrace the preceding motive trend and are labeled A-B-C. Their mathematical proportions depend on whether the correction develops as a sharp zigzag, a sideways flat, or a converging triangle.
Zigzag Corrections (5-3-5): Wave B typically retraces 38.2% to 50.0% of Wave A. Wave C then drives aggressively past the extreme of Wave A, commonly measuring 100% (equality) or 161.8% of Wave A's length.
Flat Corrections (3-3-5): In regular flats, Wave B retraces approximately 90% to 100% of Wave A, with Wave C terminating just past Wave A at a 100% to 105% measurement. In expanded flats, Wave B penetrates the start of Wave A by retracing 123.6% to 138.2%, while Wave C extends aggressively to 161.8% of Wave A.
Triangle Consolidations (3-3-3-3-3): Each consecutive sub-wave within a contracting triangle typically relates to the preceding wave by a factor of 61.8% (for instance, Wave C is 61.8% of Wave B, and Wave D is 61.8% of Wave C).
When you classify these corrective structures alongside traditional Elliott Wave patterns, Fibonacci measurements provide the objective filter that confirms whether a consolidation is ending or morphing into a complex multi-degree correction.
Strongest momentum, high volume, rarely shortest wave
Shorter than both Wave 1 and Wave 5
Wave 4
23.6%–38.2% of Wave 3
Shallow, time-consuming consolidation
Enters price territory of Wave 1
Wave 5
100% of Wave 1 or 61.8% of Waves 1–3
Final trend push, showing momentum divergence
Fails to move beyond the Wave 3 extreme (truncation, a warning sign rather than a broken rule)
Wave A
Baseline corrective wave
Initial counter-trend move; often sharp
None (initiating wave)
Wave B
38.2%–50.0% (Zigzag) / 123.6% (Expanded Flat)
Counter-trend relief bounce; lower volume
Exceeds 138.2% of Wave A
Wave C
100%–161.8% of Wave A
Final directional leg of the basic 3-wave correction
Reversal beyond 161.8% suggests trend change
Why Elliott Wave Fibonacci Ratios Matter for Funded Traders
In a funded account, Fibonacci wave ratios provide mathematically defined invalidation levels that allow you to take asymmetric risk-to-reward setups while keeping your risk per trade small relative to your daily and trailing drawdown limits. No setup removes the risk of loss. In our editorial experience, many traders lose evaluation attempts because of poorly timed entries rather than a wrong directional bias, which forces them to absorb drawdowns their account rules cannot sustain.
Prop firms set their own loss limits, and the numbers vary by firm and program, so confirm both on your firm's rules page before you size a trade. Most rule sets include a daily drawdown limit and an overall maximum drawdown limit. When you enter a position based on an unverified wave count, you often find yourself holding through a deep retracement, hoping the trend turns. If you enter at a random price level, your stop loss is either arbitrary or too wide.
Fibonacci ratios can help with this problem by giving you defined levels to measure risk and reward against. Entering a trade at the termination of Wave 2 near the 61.8% retracement allows you to place a hard stop loss just past the 100% invalidation origin of Wave 1. Because Wave 3 frequently expands to 161.8% or 200% of Wave 1, your trade setup may offer a theoretical 1:4 to 1:5 risk-to-reward ratio. Treat these figures as illustrations, not expectations: stops can slip, many setups fail, and wave counts are subjective.
At that level of asymmetry, you may not need a very high win rate to stay profitable over many trades, but passing a challenge is never assured. Size your position so that the distance between your 61.8% entry and the 100% invalidation point represents 0.5% to 1.0% of your total account balance. That gives you several attempts to catch a major Wave 3 extension while keeping each loss small relative to your daily loss limit. Several losses in a row, slippage or gaps can still push you toward that limit, so check your firm's rules before you trade.
Step-by-Step: Trading Wave 2 to Wave 3 with Strict Drawdown Rules
Many wave analysts consider the transition from Wave 2 into Wave 3 one of the more favorable moments to trade, but executing it inside a funded account requires structured confirmation rather than buying a sharp drop before it shows any sign of stopping.
Step 1: Identify and Confirm the Initial Impulse (Wave 1)
Do not trade the first move off a major swing low or high. Wait for a complete 5-wave micro-impulse to form on your execution timeframe (such as the 5-minute or 15-minute chart). Confirm that Wave 3 inside this micro-structure was not the shortest wave and that the move decisively broke a prior structural high.
Step 2: Anchor the Fibonacci Retracement Grid
Once the 5-wave impulse terminates and begins to pull back, anchor your Fibonacci retracement tool at the absolute swing low (the origin of Wave 1) and pull it to the absolute peak of Wave 1. Highlight the 50.0% and 61.8% levels as your primary interest zone, with the 78.6% level marking the outer boundary of acceptable risk.
Step 3: Monitor Lower-Timeframe Exhaustion in the Golden Pocket
As price declines into the 50.0%–61.8% zone (traders call this area the "golden pocket"), do not place blind limit orders. Drop down one timeframe and look for a corrective 3-wave (a-b-c) sub-structure to complete within the retracement zone. You want to see price action compress into classic chart patterns, such as a falling wedge or a rejection pin-bar, indicating that counter-trend selling volume is exhausted.
Step 4: Calculate Sizing Against the Absolute Invalidation Line
Your invalidation line is the origin of Wave 1 (100% retracement). If price trades one tick below that low, the wave count is objectively broken. Calculate your position size using the exact dollar distance from your execution entry to this invalidation level, so that your planned loss, if the stop fills at your price, equals 0.5% to 1.0% of your account balance. Slippage and gaps can make the actual loss larger.
Step 5: Scale Profit Targets Using Fibonacci Extensions
Apply a trend-based Fibonacci extension tool from the origin of Wave 1, to the peak of Wave 1, and back down to the confirmed low of Wave 2.
Target 1 (Wave 1 high): Secure partial profits (e.g., 30% to 50% of the position) at the Wave 1 high to de-risk the trade and move your stop loss to break-even.
Target 2 (161.8% Extension): Take the primary profit tranche at the textbook Wave 3 projection.
Target 3 (261.8% Extension): Leave a small trailing runner to capture extended momentum if the market exhibits strong institutional volume.
3 Common Elliott Wave Fibonacci Traps That Can Cost You a Prop Account
Elliott Wave theory provides a useful structural framework, but misapplying its Fibonacci guidelines creates cognitive traps that can quickly ruin a funded account.
Trap 1: The "Deeper Retracement" Averaging-Down Trap
The textbook rule states that Wave 2 is valid as long as it does not retrace 100% of Wave 1. Traders often use this rule to justify risky behavior. They enter at the 61.8% retracement, add to the position at 78.6%, and double down at 88.6%, telling themselves that the wave count is still intact.
In a personal cash account, you might survive such drawdowns. In a funded account, this averaging-down behavior creates a compounding margin requirement and an escalating open loss.
If the market spikes through the 100% level to trigger clusters of stop orders (a liquidity sweep), your accumulated position will breach your daily loss limit or trailing maximum drawdown before you can react. If price keeps falling with aggressive momentum, do not add to the position. Exit at your predefined stop. Never scale into a decaying count.
Trap 2: Hindsight Ratio Fitting and Denial
Because financial markets produce endless micro-swings, a trader suffering from confirmation bias can always find a combination of Fibonacci ratios to justify why their original directional thesis is still "correct". When their Wave 2 count is invalidated, they re-label the move as an "extended wave" or a "complex double three" correction (a longer correction built from two simpler corrective patterns) rather than accepting that their setup failed.
This cognitive trap is especially costly under prop firm evaluation rules. Elliott Wave is not a predictive crystal ball; it is a probability filter. When a Fibonacci invalidation level is breached, the trade is finished. Re-labeling charts in the middle of an active drawdown is denial disguised as technical analysis.
Trap 3: Breakout FOMO (Fear of Missing Out) on Wave 3
Traders often read that Wave 3 is the most powerful wave in the cycle and panic when they miss the initial reversal out of Wave 2. They wait until price breaks decisively above the peak of Wave 1 and enter with large position sizes right as the market reaches the 100% extension level.
Entering an impulse trade after price has already traveled the full distance of Wave 1 leaves you vulnerable to a sharp Wave 4 consolidation. Even a normal, shallow Wave 4 pullback (23.6% to 38.2% of Wave 3) can push price against you (what traders call adverse excursion) far enough to trigger a prop firm's trailing drawdown lock. If you miss the primary Wave 2 entry pocket, do not chase the breakout. Wait patiently for Wave 3 to exhaust and enter on the subsequent Wave 4 pullback instead.
Using Elliott Wave Fibonacci Risk Rules on a Funded Account
Elliott Wave theory provides the structural map of the market, but Fibonacci ratios establish the risk parameters that make the strategy tradable inside a funded account. By utilizing the 50.0%–61.8% golden pocket for Wave 2 entries and targeting Wave 3 expansions at 161.8%, you can aim for favorable risk-to-reward ratios while keeping position sizing controlled, which may support your efforts to pass an evaluation. Passing is never guaranteed. Success in prop trading often depends less on forecasting every market pivot and more on closing positions promptly when a Fibonacci invalidation level proves your wave count wrong.
Once you can map wave invalidations with mathematical discipline, the next step is mastering structural confirmations. Explore our guide to chart patterns to refine your execution entries.
FAQ
What is the difference between a Fibonacci retracement and a Fibonacci extension in Elliott Wave?
In Elliott Wave analysis, a Fibonacci retracement measures the depth of a counter-trend pullback within an established wave, such as Wave 2 retracing a percentage of Wave 1. A Fibonacci extension is used to estimate how far the next impulsive wave may travel beyond the previous swing high, such as forecasting Wave 3 extending to 161.8% of Wave 1. Retracements help you identify possible entry zones, while extensions help you set profit targets.
Can Wave 2 retrace more than 61.8% in an Elliott Wave structure?
Yes, Wave 2 can retrace deeper than 61.8%, occasionally reaching the 78.6% or 88.6% Fibonacci levels, particularly in volatile markets like foreign exchange or crypto. However, Elliott Wave rules state that Wave 2 cannot retrace 100% or more of Wave 1. In a funded account, holding deep retracements calls for reducing position size so that a drop to the 100% origin level stays small relative to your daily loss limit. Slippage and gaps can still make losses larger than planned.
How do you identify which wave degree to trade on intraday funded accounts?
Funded day traders typically map macro wave structures on the 1-hour or 4-hour chart to identify the prevailing impulse direction, then execute on the 5-minute or 15-minute timeframe. This multi-timeframe approach can help you align with the higher-degree Wave 3 expansion while using lower-degree Fibonacci retracements to place tighter invalidation stops, which may help keep potential losses within your prop firm's drawdown parameters. It does not remove the risk of loss.
What indicators pair best with Elliott Wave Fibonacci setups?
Momentum oscillators like the Relative Strength Index (RSI) and volume profiles pair effectively with Elliott Wave Fibonacci analysis. Bullish divergence on the RSI as price touches a 61.8% Fibonacci retracement can suggest that selling pressure is fading, which may provide secondary confirmation for a Wave 2 reversal. Similarly, expanding volume on a breakout past Wave 1 may support the case that a genuine Wave 3 impulse is underway.
What should you do if price blows through a Fibonacci level without reacting?
If price cuts straight through a key Fibonacci level like 61.8% without showing signs of reversal or price compression, do not average down or move your stop. An unreactive level indicates strong counter-trend momentum that could easily invalidate the entire structure. Accept the stop out at your predefined invalidation level, wait for the market to complete its corrective cycle, and rebuild your wave count objectively.
Disclaimer
Disclaimer: This guide was written with AI assistance, reviewed for accuracy by the Proptary editorial team, and kept up to date. It's for education only — not financial advice. Prop trading and the financial markets carry a significant risk of loss, so consider your own situation and consult a licensed advisor before you trade.
Proptary editorial team independently reviews prop trading firms, verifies payouts, and explains the rules that decide who keeps an account. We disclose affiliate relationships and publish methodology for every score.