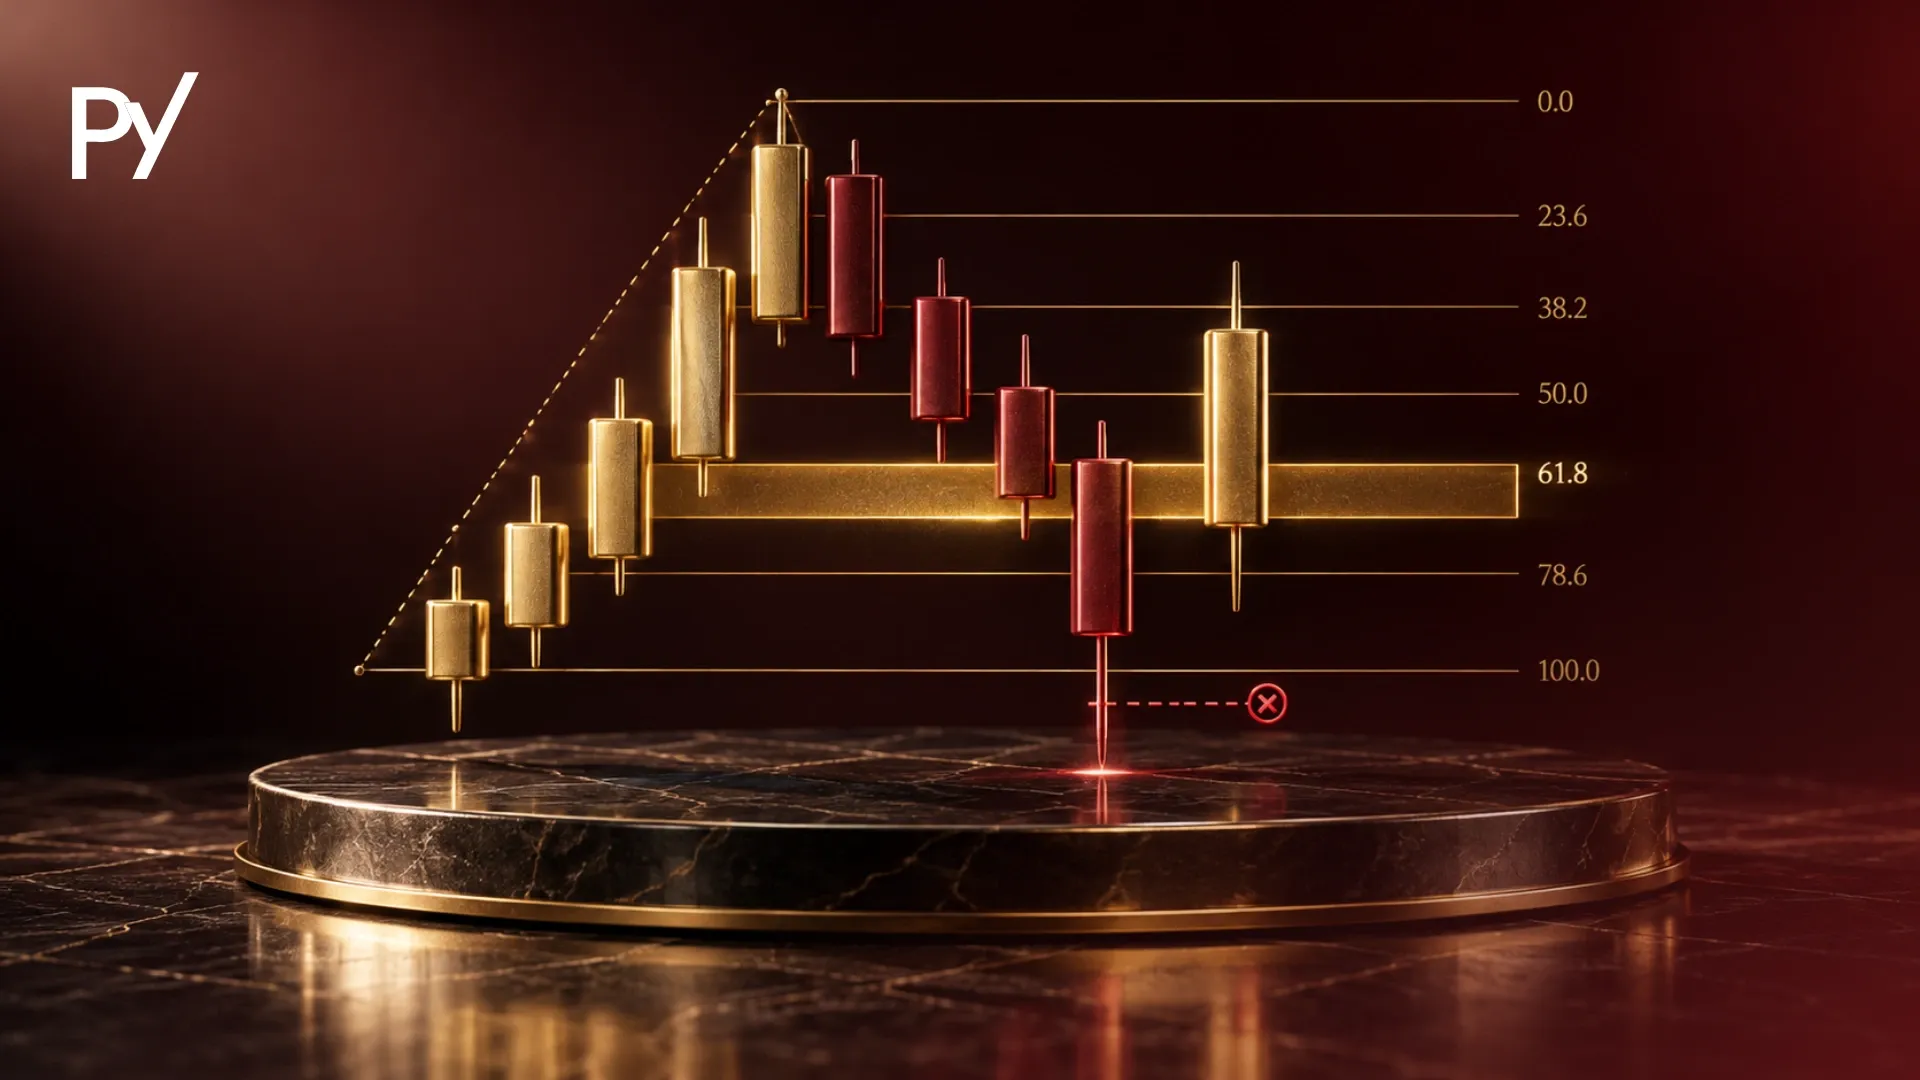
An expanded flat Elliott Wave is a 3-3-5 corrective structure where Wave B breaks beyond the origin of Wave A, and Wave C extends past the endpoint of Wave A. It creates a false breakout trap in Wave B before sweeping liquidity in Wave C, making it a critical pattern to identify for risk control.
If you trade an evaluation or a funded account, an expanded flat Elliott Wave is worth recognizing early, because it can look like a trend breakout at first.
For funded account traders, this structure can be a difficult market environment. Wave B creates a deceptive breakout that traps premature buyers, while Wave C delivers an aggressive 5-wave liquidation flush that can breach daily or trailing drawdown limits. Understanding this pattern helps you protect your capital during complex market consolidations.
What Is an Expanded Flat Elliott Wave?
An expanded flat Elliott Wave is a three-wave corrective price structure categorized by a 3-3-5 internal sub-wave count and large price overshoots at both extremities.
In Ralph Nelson Elliott's wave theory, market movements are divided into motive trends (5 waves) and corrective consolidations (3 waves). While standard flat corrections move sideways within relatively stable horizontal boundaries, an expanded flat (sometimes called an irregular flat) expands beyond those boundaries in both directions.
The defining characteristic of an expanded flat is its internal sub-wave sequence, which strictly follows a 3-3-5 structure:
Wave A (3 Sub-waves): The initial counter-trend move unfolds in three sub-waves (a-b-c). Because it lacks the dynamic power of a 5-wave impulse, Wave A indicates that the primary trend is merely resting rather than undergoing a full reversal.
Wave B (3 Sub-waves): The secondary move turns back in the direction of the main trend, also unfolding in three sub-waves. However, Wave B exhibits aggressive momentum, carrying price entirely past the starting price level (origin) of Wave A.
Wave C (5 Sub-waves): The final leg reverses sharply against the primary trend, unfolding as a full 5-wave motive structure (an impulse or an ending diagonal, which is a wedge-shaped 5-wave pattern). Wave C drives price completely past the termination point of Wave A before the larger trend resumes.
Expanded flat corrections often appear during strong primary trends, when counter-trend participants attempt to take control. This leads to two-sided liquidity sweeps (sharp moves that run through clusters of stop orders): first trapping breakout traders above Wave A, and then flushing out stop-loss orders below Wave A.
How the Expanded Flat Pattern Works: Wave Mechanics & Fibonacci Ratios
An expanded flat operates through specific mathematical proportions where Wave B overshoots Wave A's origin using Fibonacci extensions, followed by Wave C projecting past Wave A's endpoint.
To identify a valid expanded flat on live charts, you must measure the retracement and extension ratios of each individual sub-wave using Fibonacci tools. Applying Elliott Wave Fibonacci relationships helps you map potential reversal zones rather than guessing where price might turn.
Fibonacci Ratio Guidelines
Wave B Measurement: Measure Wave B as a retracement/extension of Wave A. In an expanded flat, Wave B must retrace at least 105% of Wave A, commonly terminating between 123.6% and 138.2%. In extreme market volatility, Wave B can stretch up to 161.8%.
Wave C Measurement: Measure Wave C relative to Wave A. Wave C typically terminates between 100% and 161.8% of the length of Wave A, projected downward from the high of Wave B. In elongated corrections, Wave C can extend up to 261.8%.
Step-by-Step Price Scenario
To visualize how this mathematical structure plays out in a bullish primary trend, consider the following numeric example:
Primary Trend Peak: An asset in a strong uptrend reaches a high of $100, where buyers take profit.
Wave A Drop: Price drops in 3 sub-waves to $90 (a $10 decline establishing Wave A).
Wave B Overshoot: Buyers re-enter aggressively, driving price back up in 3 sub-waves to $104. This represents a 140% retracement of Wave A, exceeding the $100 high and sweeping buy-side liquidity.
Wave C Liquidation Flush: Sellers take control and push price down in a rapid 5-wave impulse. Measuring 161.8% of Wave A ($10 × 1.618 = $16.18) downward from the Wave B high ($104) yields a Wave C target of $87.82. Price flushes down to $88, sweeping stop losses below the $90 Wave A low.
Trend Continuation: With liquidity cleared on both sides, the 3-3-5 correction completes, and the primary uptrend resumes toward new highs.
Expanded Flat vs. Running Flat: Key Structural Differences
The critical difference between an expanded flat and a running flat Elliott Wave lies in the terminal distance achieved by Wave C relative to the origin and end of Wave A.
While both variations feature a Wave B that overshoots the starting point of Wave A, they diverge significantly in how Wave C behaves. In a running flat Elliott Wave, the underlying momentum of the primary trend is so exceptionally strong that Wave C fails to retrace the full distance of Wave A. Instead of flushing past Wave A's endpoint, Wave C truncates prematurely, ending well short of the Wave A boundary.
Understanding how these flat corrections differ from standard chart patterns requires evaluating their structural rules side-by-side:
Structural Feature
Regular Flat
Expanded Flat
Running Flat
Sub-Wave Count
3-3-5
3-3-5
3-3-5
Wave B Length
Reaches ~100% of Wave A origin
Exceeds Wave A origin (>105%–138.2%)
Exceeds Wave A origin (>105%–138.2%)
Wave C Terminal Depth
Reaches ~100% of Wave A endpoint
Extends past Wave A endpoint (>100%–161.8%)
Truncates short of Wave A endpoint (<100%)
Underlying Trend Strength
Moderate / Neutral
Strong / High Volatility
Extremely Strong
False Breakout Severity
Low
High (sweeps both sides)
Medium (sweeps origin only)
In a running flat, buyers refuse to allow price to discount deeply, cutting Wave C short before it can clean out stops below Wave A. In an expanded flat, market liquidity sweeps both above and below the range before equilibrium is restored.
Why Expanded Flats Are Dangerous for Funded Account Traders
Expanded flats pose a serious risk to funded account traders because the Wave B false breakout induces premature entry, while the high-volatility Wave C impulse can breach daily or trailing drawdown limits.
Prop firm risk parameters leave little room for structural misunderstanding. When managing an evaluation or funded account, encountering an expanded flat exposes your portfolio to two distinct risk traps:
1. The Wave B Breakout Trap
When Wave B rallies past the origin of Wave A, traditional breakout traders and momentum algorithms see price taking out a major swing high. Assuming the broader uptrend has resumed, funded traders enter long positions with full position sizing.
However, because Wave B is built on a 3-sub-wave corrective structure rather than a true 5-wave impulse, it lacks structural backing. Once buy-side liquidity is swept, price can reverse abruptly into Wave C, leaving long positions trapped near the top of the move.
2. The Wave C Trailing Drawdown Threat
Wave C is not a slow drift; it is a 5-wave motive move that often drops with high velocity and widening spreads. If a funded trader attempts to "scale in" or hold onto a bad position during Wave C, the decline will breach maximum loss limits.
For accounts whose drawdown limits trail peak equity (rules vary by firm), Wave B inflates the account peak equity high. When Wave C flushes down past Wave A, the open drawdowns calculated from that inflated Wave B peak can breach the daily limit and may lead to account termination before the primary trend resumes.
Execution Protocol for Funded Accounts
To manage the extra risk that expanded flat corrections can create on a funded account, consider these three practical rules. They can reduce risk, but they cannot remove it:
Audit the Sub-waves of Wave B: Never buy a breakout above Wave A's origin unless you can count 5 clear internal impulse sub-waves. If Wave B moves in a 3-wave (a-b-c) overlap, treat it as a false breakout.
Wait for 5 Sub-waves in Wave C: Do not attempt to buy into the decline too early during Wave C. Wait for Wave C to complete sub-waves 1 through 5, hit a key Fibonacci extension zone (100% or 161.8%), and show a clear structural shift on lower timeframes.
Use Fixed-Dollar Stop Losses: Do not rely only on structural Elliott Wave invalidation points when they sit dozens of pips away from your entry. Cap risk at a small percentage of your daily drawdown allocation (e.g., 0.5% to 1% per trade), and close the trade if price invalidates your wave count.
Common Mistakes and Traps When Charting Expanded Flats
Elliott Wave counts are subjective, and an expanded flat can only be confirmed after Wave C is complete. Two analysts can label the same chart differently, so treat every count as a working hypothesis and keep an exit plan for when price invalidates it.
Traders most frequently fail when charting expanded flats by confusing 3-wave corrective movements with 5-wave impulsive trends, miscalculating Fibonacci extensions, and entering positions before Wave C exhausts its 5 sub-waves.
Mistake 1: Confusing 3-Wave Corrections with 5-Wave Impulses
The foundation of Elliott Wave mapping is accurate sub-wave counting. Traders often see price moving aggressively during Wave B and assume it is Wave 3 of a new impulse trend. If you fail to inspect the lower timeframe sub-waves, you will trade in the wrong direction right as the corrective structure reverses.
Mistake 2: Entering Early During Sub-Wave 3 of Wave C
Because Wave C moves in 5 sub-waves, it contains its own internal sub-wave 3, which is usually the fastest and longest leg of the drop. Premature traders often try to buy the first sign of support at the end of sub-wave 3 of C, only to get liquidated during sub-wave 5 as price sweeps final lows.
Mistake 3: Forgetting Higher-Timeframe Trend Direction
An expanded flat is a corrective structure designed to consolidate a larger trend. Trading an expanded flat on a 5-minute chart without knowing the 4-hour trend direction is an easy way to lose capital. Always ensure the terminal point of Wave C aligns with major daily or 4-hour support/resistance levels.
Key Takeaways for Trading the Expanded Flat Elliott Wave
Expanded flat corrections are market structures that demand patience and disciplined risk control. By mapping out the 3-3-5 sub-wave count and measuring Fibonacci extension levels on Wave B and Wave C, you can reduce your exposure to classic false breakout traps. For funded account traders, preserving capital during these volatile liquidity sweeps is essential to staying within drawdown boundaries.
FAQ
What is the difference between an expanded flat and a running flat in Elliott Wave?
Both patterns feature a Wave B that overshoots the starting point of Wave A. However, in an expanded flat, Wave C extends past the termination point of Wave A. In a running flat, strong underlying trend momentum causes Wave C to truncate prematurely, ending before it can reach the endpoint of Wave A.
What is the internal sub-wave structure of an expanded flat pattern?
An expanded flat strictly follows a 3-3-5 internal sub-wave structure. Wave A consists of 3 corrective sub-waves, Wave B unfolds in 3 corrective sub-waves, and Wave C completes as a dynamic 5-wave motive structure (either an impulse or an ending diagonal) that flushes past Wave A.
How are Fibonacci retracements and extensions applied to Wave B and Wave C?
Wave B is measured as a retracement of Wave A, typically terminating between 105% and 138.2% (or up to 161.8%). Wave C is projected from the peak of Wave B as a 100% to 161.8% extension of Wave A's length, marking key reversal target zones.
Why is Wave B in an expanded flat called a false breakout?
Wave B rallies past the origin of Wave A, taking out recent swing highs and often convincing trend-following traders that the primary trend has resumed. Because Wave B only contains 3 corrective sub-waves rather than a 5-wave impulse, it lacks structural backing and can reverse quickly into the Wave C liquidation flush.
Where should stop-loss and risk limits be set during an expanded flat correction?
Traders should avoid placing wide stops at structural invalidation points during sideways Wave B moves. Instead, wait for Wave C to complete all 5 sub-waves into a high-confluence Fibonacci extension zone, where several technical levels overlap (100% to 161.8% of Wave A) and define fixed-dollar risk relative to daily drawdown limits. Because Elliott Wave counts are subjective, treat any count as a working hypothesis and exit if price invalidates it.
Disclaimer
Disclaimer: This guide was written with AI assistance, reviewed for accuracy by the Proptary editorial team, and kept up to date. It's for education only — not financial advice. Prop trading and the financial markets carry a significant risk of loss, so consider your own situation and consult a licensed advisor before you trade.
Proptary editorial team independently reviews prop trading firms, verifies payouts, and explains the rules that decide who keeps an account. We disclose affiliate relationships and publish methodology for every score.