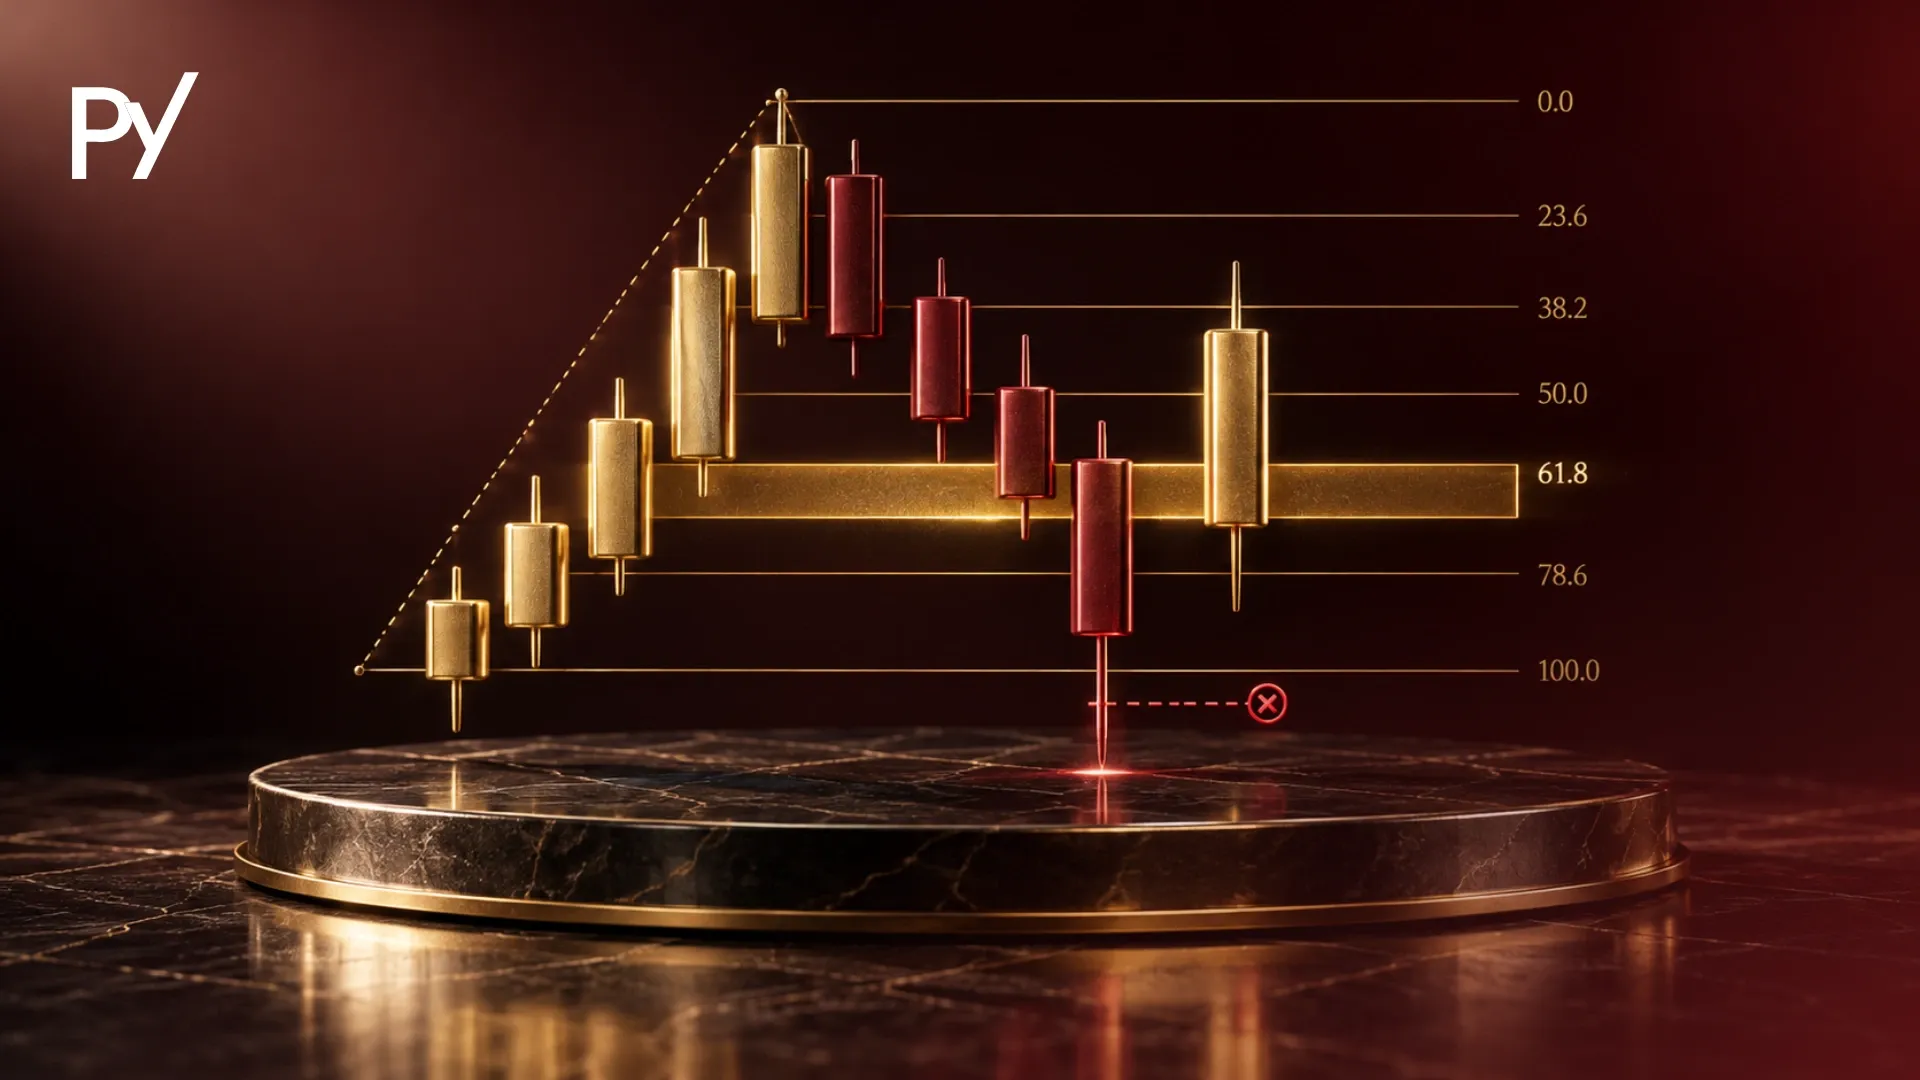
A Renko chart is a price-based trading visualization that constructs bricks of a fixed price size while completely ignoring time intervals and trading volume. New bricks only render when price travels a predetermined distance, effectively filtering out market noise and choppy consolidation. However, because bricks hide intrabar price wicks, live floating equity can breach prop firm daily drawdown limits mid-brick.
The Renko method plots price in fixed increments, and its name comes from the Japanese word renga (bricks).
If you have ever been stopped out by a single noisy candle wick before the market resumed your direction, traditional time-based charts are working against you. This guide explains how Renko bricks form, how Average True Range (ATR) and fixed sizing methods differ, classical brick trading strategies, and why time-independent charts present a hidden drawdown risk for funded traders.
What Is a Renko Chart?
A Renko chart is a visual trading model developed in Japan that filters market noise by constructing price bricks based solely on pre-set price movements rather than fixed time frames. Named after renga, the Japanese word for brick, this charting method strips away time and volume to isolate underlying structural momentum.
On a standard candlestick chart, a new candle prints every minute, hour, or day regardless of how little price moves. During low-volatility Asian sessions or midday equity lulls, time-based charts generate dozens of small, overlapping candles with long wicks. These choppy patterns frequently trigger false breakout signals and induce emotional overtrading.
In contrast, Renko ignores elapsed time entirely. If price moves 50 pips in two minutes during a high-impact news release, a 10-pip Renko chart prints five consecutive bricks in seconds. Conversely, if price consolidates in a tight 8-pip range for six hours, the chart remains completely static, printing zero new bricks.
Bricks display at uniform 45-degree angles. Bullish up-bricks are typically colored green or white, while bearish down-bricks appear red or black. Because each brick represents an identical increment of price movement, the resulting visual structure highlights trend strength and support/resistance boundaries without clutter.
How Renko Charts Work: Brick Sizing and Mechanics
This method operates by generating uniform blocks called bricks whenever price moves beyond a defined value threshold. Understanding how these bricks construct and reverse is vital for executing precise entries and managing trade risk.
1. Brick Sizing Methods: Fixed vs. ATR
Before loading a Renko chart, you must select how brick size is calculated:
Feature
Fixed Brick Sizing
ATR-Based Sizing
How brick size is set
You set one static pip, point, or dollar distance (e.g., 10 pips on EUR/USD, 20 points on Nasdaq futures, or $1.00 on AAPL).
Size is calculated from the Average True Range (ATR) indicator over a set period (such as a 14-day ATR).
Adapts to volatility
No. Size stays the same until you change it.
Yes. Size changes as market volatility changes.
Historical bricks
Stay at the same price levels, which suits backtesting mechanical trading strategies.
Can repaint. As ATR changes, past brick boundaries recalculate and alter past entry points on your screen.
2. Brick Formation and the 2x Reversal Rule
Renko construction follows rigid mathematical rules based on current price relative to the previous brick's boundaries:
Up-Brick Creation: A new bullish brick prints when price closes above the top of the previous brick by the exact designated brick size.
Down-Brick Creation: A new bearish brick prints when price closes below the bottom of the previous brick by the exact designated brick size.
The 2x Directional Reversal Rule: To trigger a trend reversal, price must traverse twice the brick size in the opposite direction. For example, on a 10-pip Renko chart, if the current bullish brick spans 1.1010 to 1.1020, price does not print a red down-brick when it falls 10 pips back to 1.1010. It must drop 20 pips down to 1.1000 before a new bearish reversal brick renders.
3. Intrabar Data and Renko Wicks
Standard Renko charts omit wicks entirely, displaying hollow or filled blocks. However, modern charting platforms offer optional Renko wicks. These wicks extend from the top or bottom of a brick to show the extreme intrabar high or low reached before the brick finalized. Visualizing wicks helps traders detect early rejection pressure before a full 2x directional reversal prints.
Renko Charts vs. Other Noise-Filtering Charts
Comparing Renko to other noise-reducing formats highlights how different price-filtering algorithms transform identical market data into visually distinct structures.
Feature
Renko Charts
Standard Candlesticks
Point & Figure Charts
Primary Axis
Price only (time ignored)
Price & time (fixed intervals)
Price only (time ignored)
Visual Structure
Uniform 45-degree bricks
Varying candle heights & wicks
Vertical columns of X's and O's
Reversal Rule
Fixed 2x brick distance
Single candle close
Multi-box reversal (e.g., 3-box)
Volume Display
Distorted (volume per brick)
Accurate (volume per interval)
Excluded entirely
Noise Reduction
High
Low
Very high
While candlesticks reflect total time elapsed, both Renko and the point and figure chart remove time to highlight structural supply and demand.
A point and figure chart stacks X's (bullish) and O's (bearish) in vertical columns, shifting to a new column only when price reverses by a specified box count (such as a 3-box reversal rule).
Renko maintains a continuous diagonal layout where every brick steps up or down by one unit. This visual diagonal layout can make Renko charts more intuitive for layering trend-following overlays like moving averages.
Renko Chart Strategies and Classical Brick Patterns
Building an effective Renko chart strategy requires combining clean brick momentum signals with objective risk boundary rules. Because Renko filters out minor fluctuations, classical charting patterns display with geometric precision.
1. Exponential Moving Average (EMA) Brick Crossovers
Layering short-term Exponential Moving Averages—such as a 9-period and 21-period EMA—over Renko brick closes can form the basis of a trend-following system, although no setup works in every market condition.
Long Setup: Wait for a red series of down-bricks to exhaust, followed by a 2x green reversal brick. Enter long when the 9 EMA crosses above the 21 EMA on the close of the second consecutive green brick.
Short Setup: Wait for a green series of up-bricks to exhaust, followed by a 2x red reversal brick. Enter short when the 9 EMA crosses below the 21 EMA on the close of the second consecutive red brick.
By filtering out intrabar wicks, Renko charts can reduce some of the false moving average crossovers that whipsaw traders on standard 5-minute candlestick charts, but they do not remove false signals entirely. These setups show entry logic only, so define your stop-loss and exit rules before you trade and test them on a demo account first.
Double Tops & Double Bottoms: On a candlestick chart, identifying equal tops is complicated by wick spikes. On a Renko chart, a double top forms when a column of green bricks reaches an exact prior brick high, fails to print an additional up-brick, and immediately prints a 2x red reversal brick.
Consolidation Breakouts: When price ranges sideways, Renko bricks alternate between single green and red blocks in a horizontal channel. A possible trading signal appears when price breaks out to print two consecutive bricks of the same color outside the channel boundary.
3. Integrating Momentum Indicators
To prevent buying into mature trends right before a 2x reversal, pair brick direction with momentum oscillators like the Relative Strength Index (RSI) or Moving Average Convergence Divergence (MACD). These technical indicators help spot bearish divergence—where price prints higher Renko brick highs while RSI forms lower highs—signaling impending trend exhaustion.
The Prop Firm Drawdown Trap: Signal Lag and Hidden Intrabar Spikes
The fundamental danger of using Renko inside a funded trading account is that smooth visual bricks obscure live equity fluctuations occurring inside the brick. While noise filtering aids visual analysis, it introduces systemic execution risks under prop firm rules.
1. The Entry Lag Penalty
Because a Renko brick only renders after price completes the entire brick distance, you cannot enter a trade at the beginning of a move. By the time a bullish reversal brick prints, price has already traveled two full brick distances from its local low.
Entering on brick confirmation means your entry price is significantly delayed. In fast-moving markets, this entry lag reduces your risk-to-reward ratio and increases slippage, forcing you to risk wider stop losses to stay in the trade.
2. The Intrabar Equity Trap and Daily Loss Rules
Prop firm accounts operate under strict risk limits, including maximum daily loss limits and trailing drawdown thresholds. A daily loss limit caps how much you can lose in one day, while a trailing drawdown limit caps how far your account can fall from its highest point.
How Risk Engines Monitor Equity: Many prop firm evaluation engines do not care about chart brick closes. They typically monitor your open trade equity continuously on a live tick-by-tick basis, but how daily loss and drawdown are measured differs by firm, so confirm it in your firm's rulebook.
The Mid-Brick Violation: Imagine you are long on a 20-point Nasdaq 100 E-mini futures (NQ) Renko chart. Price rises 18 points—not quite far enough to print a new green brick. Suddenly, an economic news spike drives price down 35 points in two seconds before bouncing back up.
The Outcome: Visually, your Renko chart never printed a red down-brick because the price recovered before the brick completed. However, during those two seconds of downside spike, your live floating account equity breached your prop firm's trailing drawdown limit. Your funded account is terminated automatically mid-brick, even though your chart looks completely calm.
3. Risk Management Adjustments for Funded Traders
If you trade with Renko charts on evaluation or funded accounts, you must adapt your risk parameters:
Calculate Risk from Absolute Price, Not Brick Boundaries: Never calculate position sizing based on brick count alone. Calculate dollar risk using raw pip/point distances to your hard order-book stop-loss.
Enable Renko Wicks: Always turn on intrabar wicks to visualize historical volatility spikes that occurred inside previous bricks.
De-leverage Position Size: Consider reducing your standard lot size so a sudden intrabar spike uses less of your daily loss and drawdown buffer. A smaller size lowers the chance of breaching a limit but does not remove it, so work out your size from your stop-loss distance and your firm's own limits. A 30% to 50% cut is one illustrative starting point, not a rule.
Renko charts provide funded traders with a useful visual tool for stripping out time noise, identifying macro structural trends, and trading clean breakouts. By constructing bricks based purely on price movement, they eliminate choppy consolidation phase clutter and render support levels with geometric clarity. However, time-independent charts carry inherent signal lag and hide volatile intrabar price spikes. Because prop firm risk engines track drawdown on a continuous live tick basis, funded traders must combine Renko visuals with hard price-based stop-losses and conservative position sizing.
FAQ
What is a Renko chart and how does it differ from a candlestick chart?
A Renko chart builds bricks based purely on fixed price movements, ignoring time entirely. Standard candlestick charts print new candles at set time intervals (such as 5 minutes or 1 hour) regardless of price action. Renko charts ignore the time element and filter out small consolidation wicks, offering a smoother view of structural market trends.
What is the difference between fixed and ATR brick sizing on Renko charts?
Fixed brick sizing assigns a permanent point, pip, or dollar value to every brick, ensuring consistent chart boundaries across historical data. Average True Range (ATR) sizing dynamically adjusts brick size based on market volatility. However, ATR sizing causes historical bricks to repaint as volatility shifts, making fixed sizing better for backtesting.
What is the 2x reversal rule in Renko chart trading?
The 2x reversal rule dictates that for a Renko chart to switch brick colors from bullish to bearish (or vice versa), price must travel twice the designated brick size in the opposite direction. On a 10-pip chart, price must drop 20 pips from the current high before a new red down-brick prints.
Why do Renko charts create lag in trade entries?
Renko bricks only render after price completes the full brick distance. Because a new brick cannot print until price moves the required amount, traders enter positions after a move is already underway. This execution lag reduces potential risk-to-reward ratios and increases entry slippage in fast markets.
Can you trade Renko charts on prop firm challenges?
It is possible, but it carries added risk, so you must adjust your risk management. Many prop firm evaluation engines track open equity continuously on a tick-by-tick basis (check your firm's rulebook, as methods differ), while offline Renko charts hide intrabar price wicks. To lower the chance of triggering daily loss limits mid-brick, enable intrabar wicks, calculate stop-loss risk using raw price levels, and reduce position sizes.
Disclaimer
Disclaimer: This guide was written with AI assistance, reviewed for accuracy by the Proptary editorial team, and kept up to date. It's for education only — not financial advice. Prop trading and the financial markets carry a significant risk of loss, so consider your own situation and consult a licensed advisor before you trade.
Proptary editorial team independently reviews prop trading firms, verifies payouts, and explains the rules that decide who keeps an account. We disclose affiliate relationships and publish methodology for every score.