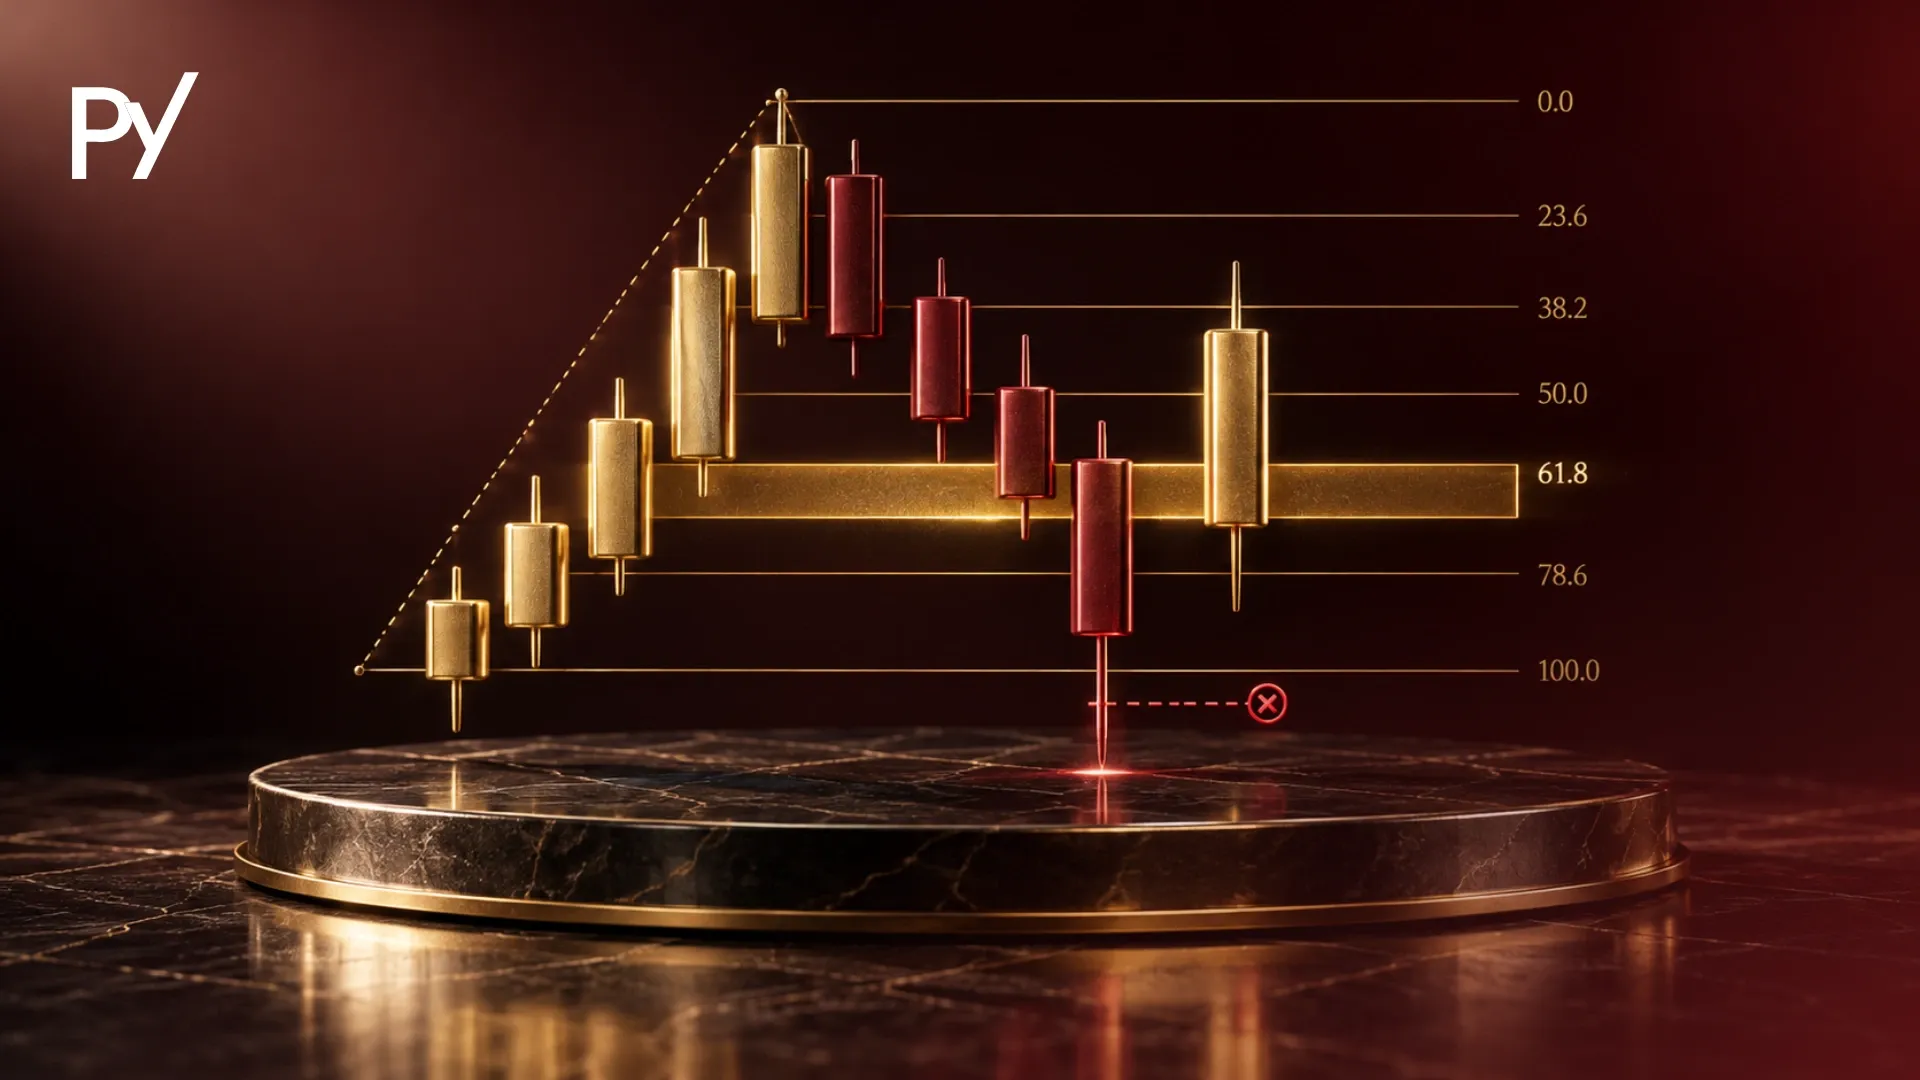
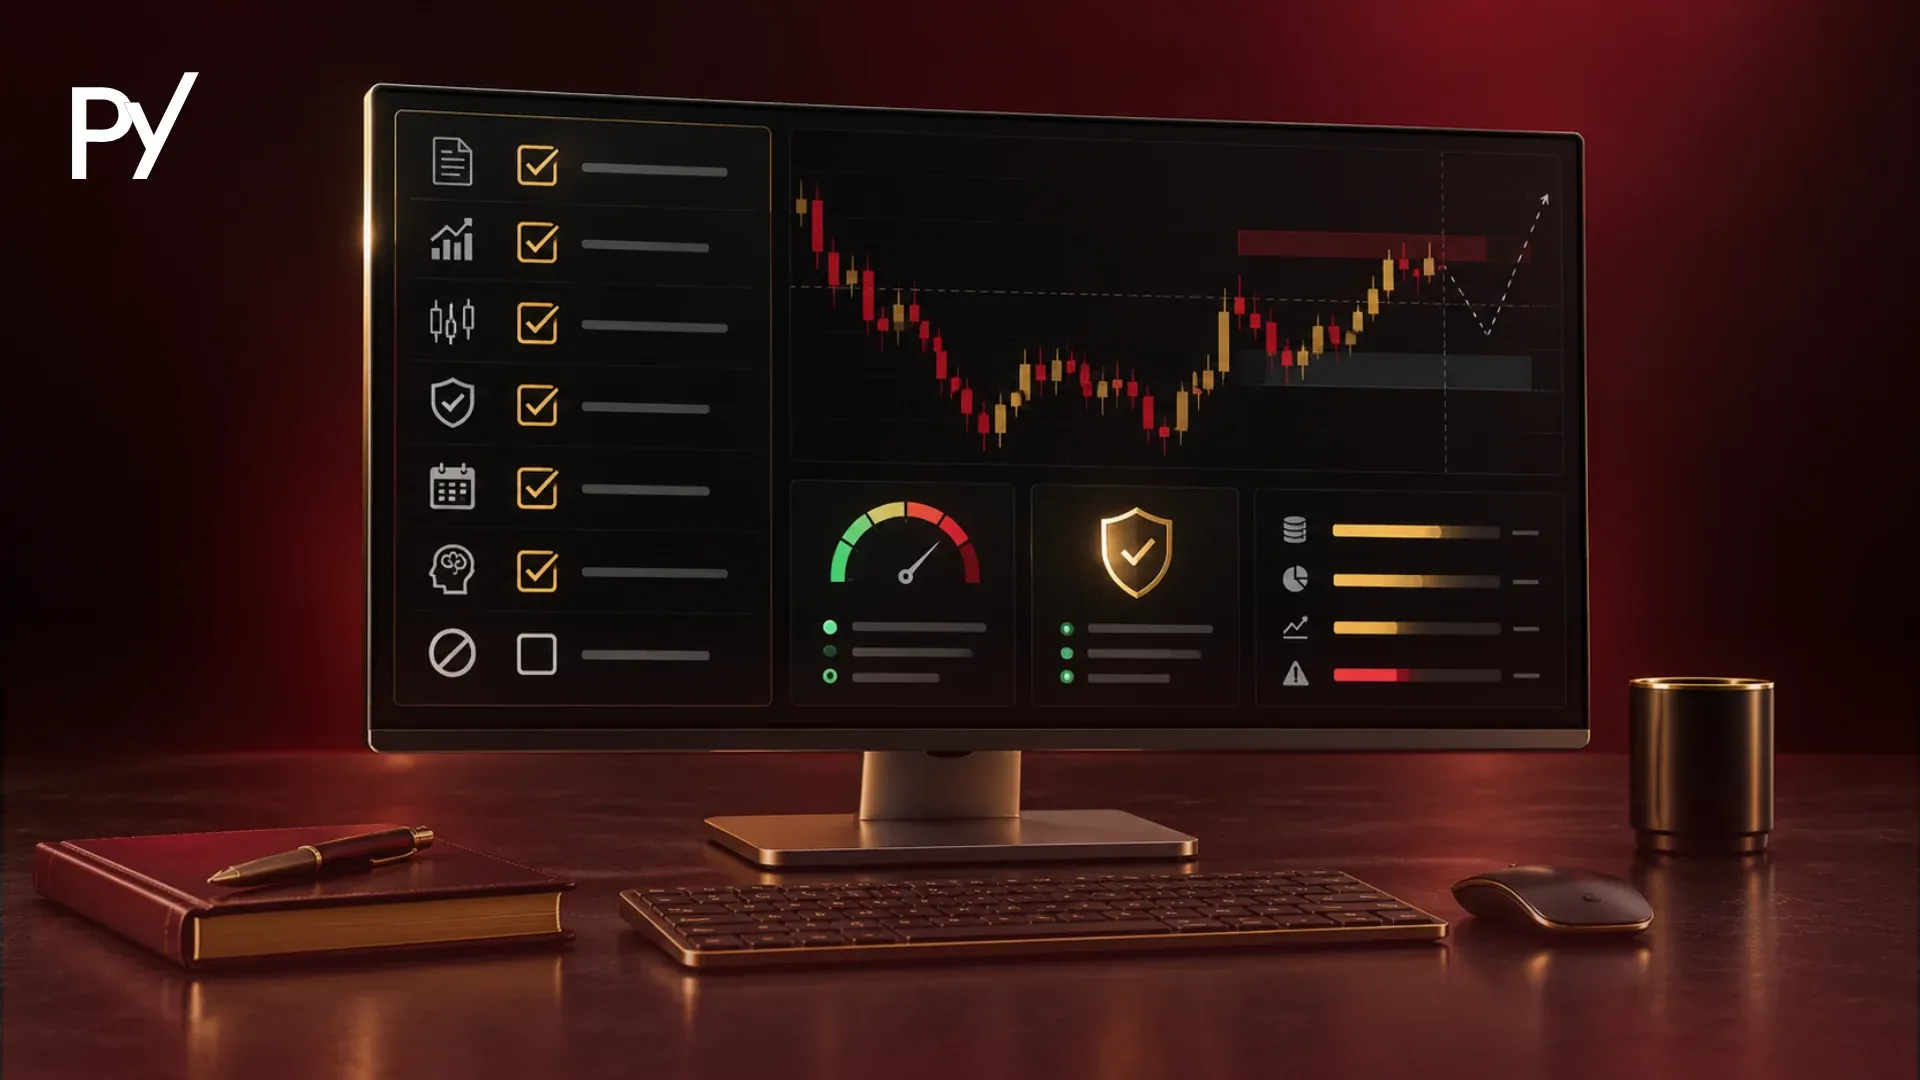
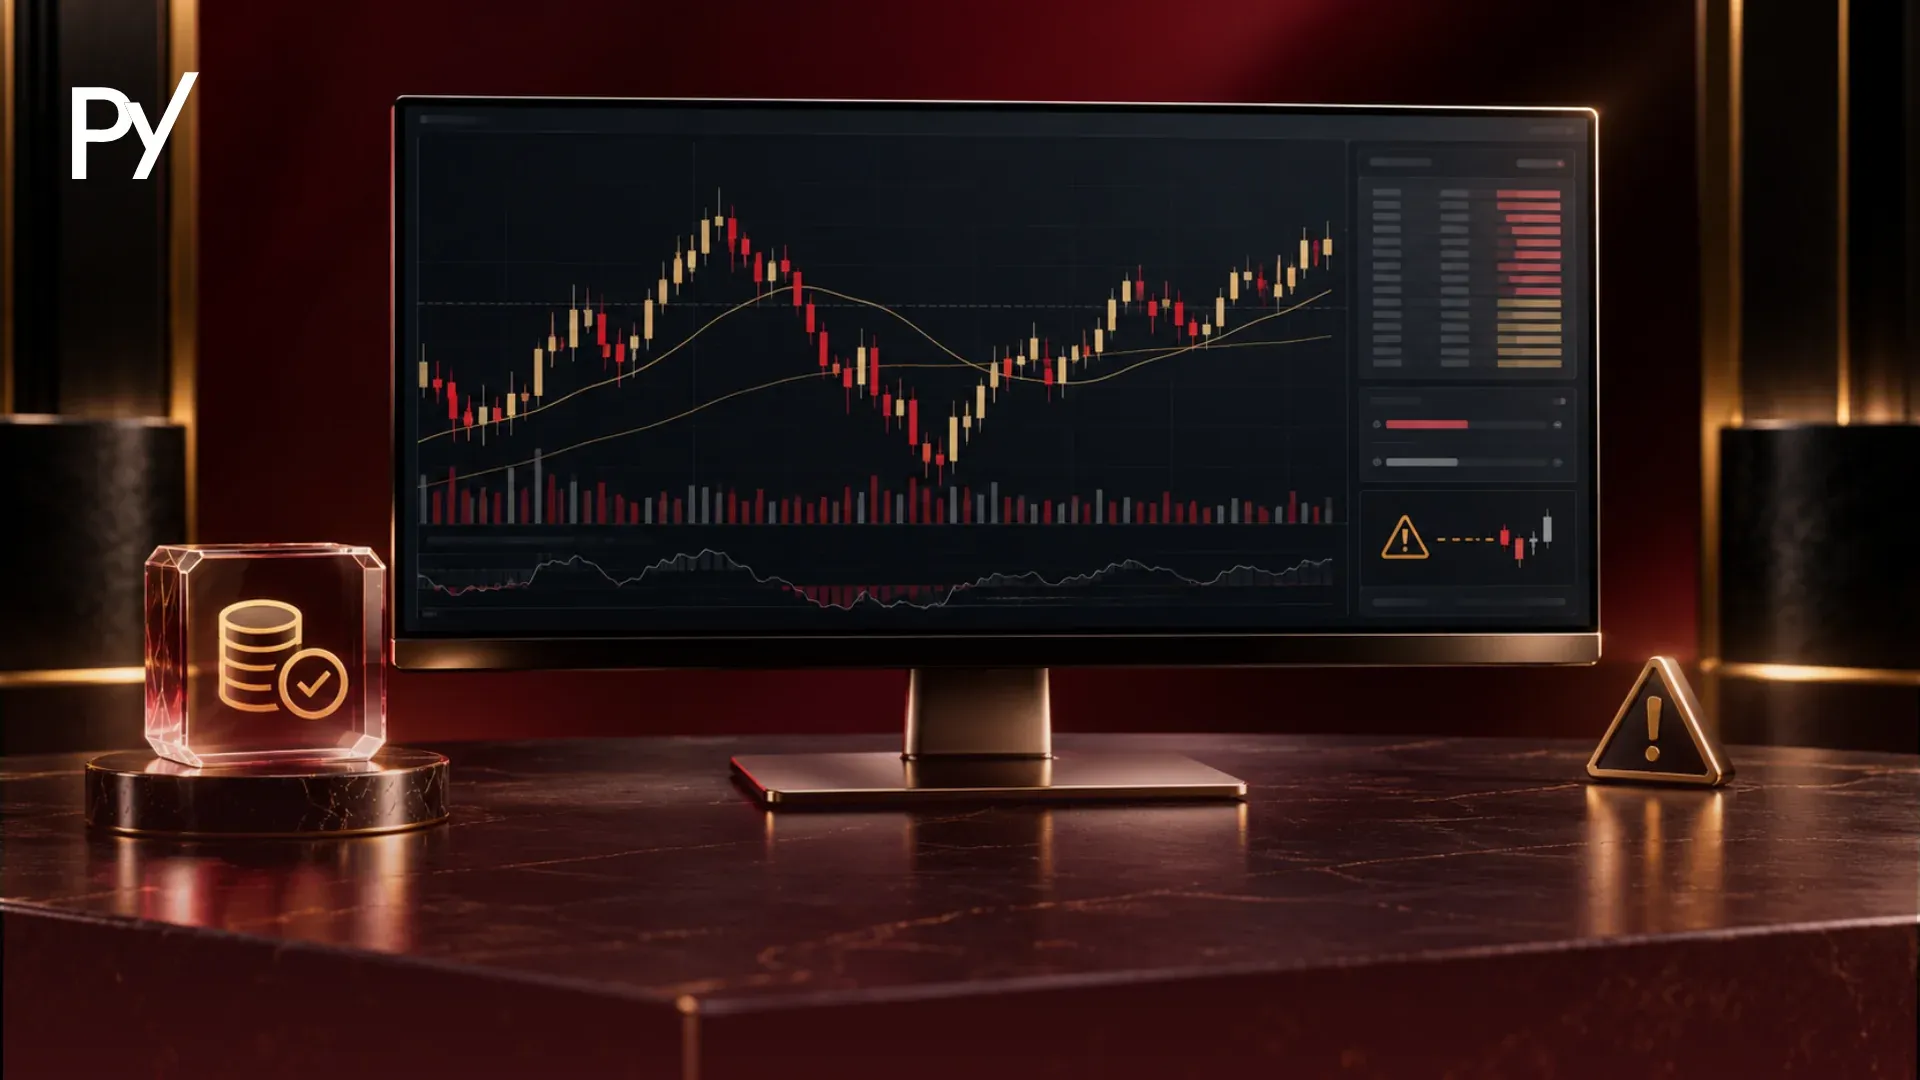
The Squeeze Momentum Indicator identifies market consolidation by plotting Bollinger Bands relative to Keltner Channels to signal when volatility is compressing. When the bands expand back outside the channels, the squeeze releases and a four-color linear regression histogram displays directional momentum.
The Squeeze Momentum Indicator is a volatility and momentum oscillator that identifies periods of extreme price compression (when Bollinger Bands contract inside Keltner Channels) before signaling potential directional acceleration via a linear regression histogram.
Some traders lose funded evaluations by forcing trades in stagnant ranges, only to watch real momentum explode right after they hit their daily loss limit. Understanding when volatility is coiling can help you avoid chop and prepare for structured breakouts. This guide breaks down the mathematics behind the squeeze, the traps that drain funded accounts, and how to approach momentum expansions with defined risk.
What Is the Squeeze Momentum Indicator?
The Squeeze Momentum Indicator is a technical tool designed to capture the structural transition between low-volatility consolidation and sharp price expansion. Financial markets do not move in continuous linear trends; they rotate through cyclical phases where prolonged consolidation builds energy that eventually releases into aggressive directional runs.
Originally developed by trader John Carter as the proprietary TTM Squeeze and later popularized on TradingView as an open-source script by developer LazyBear, the indicator combines two distinct market elements: volatility envelopes and a momentum oscillator.
Many retail traders misunderstand the tool's core premise by viewing the "squeeze" as a direct buy or sell signal. In reality, the indicator separates market state from directional force:
The Volatility State (The Dots): The centerline dots track whether the market is currently compressed in a low-volatility state or releasing into normal volatility. This tells you when a move is likely, not where it is headed.
The Momentum Oscillator (The Histogram): The histogram bars measure the velocity and direction of price change. This provides the directional context once the volatility constraint breaks.
Recognizing when volatility contracts is critical for anyone managing outside capital. Sideways, range-bound chop can quietly drain an account through repeated small losses, spreads, and commissions. By quantifying when the market is storing potential energy, the indicator can act as a filter that helps you stay flat during lower-quality conditions.
How the Indicator Works: Mechanics, Formulas, and Anatomy
The indicator operates by measuring standard deviation against average true volatility to identify mathematical price compression. When price movement tightens significantly relative to its historical baseline, a squeeze condition is triggered.
1. The Volatility Engine: Bollinger Bands vs. Keltner Channels
The squeeze mechanism relies on the mathematical relationship between two envelope indicators plotted over the same lookback period (typically 20 periods):
Bollinger Bands: Built using standard deviation to measure market dispersion around a 20-period Simple Moving Average (SMA). Standard settings apply a 2.0 standard deviation multiplier. These bands expand during volatile periods and contract sharply during quiet consolidations.
Keltner Channels: Built using Average True Range (ATR) to measure actual price movement rather than statistical variance. Standard settings place the channel bands at 1.5 ATR around a 20-period Exponential Moving Average (EMA).
A squeeze occurs when the upper Bollinger Band drops below the upper Keltner Channel, and the lower Bollinger Band rises above the lower Keltner Channel. Because 2.0 standard deviations are typically wider than 1.5 ATR in a normal market, this contraction means that recent price dispersion has fallen well below average historical volatility.
Squeeze On (Black Dots, or Red in Carter’s TTM Squeeze): The Bollinger Bands are entirely contained inside the Keltner Channels. Volatility is compressed, price is coiling, and a larger move may be setting up.
Squeeze Off / Squeeze Fires (Gray Dots, or Green in Carter’s TTM Squeeze): The Bollinger Bands expand back outside the Keltner Channels. Volatility has returned to the market, and the compression has officially released.
2. The Directional Engine: The Momentum Histogram
While the dots display volatility compression, the histogram calculates where that energy is flowing. It plots a linear regression oscillator (a line fitted to recent price movement that shows direction and speed) based on price deviation from the 20-period midline.
The histogram uses a four-color system to communicate both direction (above or below the zero line) and rate of change (acceleration versus deceleration):
Bright Green (Above Zero, Expanding): Bullish momentum is accelerating upward. Buyers are in control, and price velocity is increasing.
Dark Green (Above Zero, Contracting): Bullish momentum is decelerating. Price may still be rising or consolidating near highs, but the rate of upward change is weakening.
Bright Red (Below Zero, Expanding): Bearish momentum is accelerating downward. Sellers are aggressively driving price lower.
Dark Red (Below Zero, Contracting): Bearish momentum is decelerating. Downward selling velocity is abating, often signaling profit-taking or an impending base.
Why Volatility Compression Matters for Funded Traders
Managing an evaluation account or a live funded allocation introduces structural risk constraints that do not exist in standard personal brokerage accounts. Understanding volatility compression can help you stay within the two rules that shape most evaluations: maximum daily loss limits and trailing drawdown floors.
Prop firm rules vary, but many evaluations set a maximum daily loss of roughly 4% to 5% and a maximum total drawdown of roughly 8% to 10%. Check the exact limits on your firm’s own rules page before you plan any trade. If you trade during a compression phase, price oscillates in tight, erratic ranges.
Entering repeatedly inside an active squeeze exposes you to a string of small losses: spread friction, commissions, and premature stop-outs steadily bleed your equity curve. By the time the squeeze actually fires, your remaining daily drawdown buffer may be too depleted to take the expansion trade you were waiting for.
Compression also distorts how support and resistance look. Without checking for a squeeze, traders often misread quiet market conditions as clean support and resistance levels. When a squeeze breaks, those static levels often fail.
Another critical threat is trailing drawdown sensitivity. Many futures and CFD prop firms track trailing drawdown relative to your peak intraday equity (the high-water mark). When a squeeze fires and produces a strong impulse leg, unrealized gains increase quickly. If you fail to recognize momentum deceleration (the shift from bright bars to dark bars), a fast mean-reversion pullback (a quick move back toward the average price) can wipe out your open profit while leaving your trailing drawdown floor permanently elevated at the peak.
How to Trade the Squeeze: Execution, Invalidation, and Risk Rules
Trading the squeeze effectively requires waiting for clear mechanical confirmation rather than predicting which way the compression will break.
The 5-Step Execution Framework
Identify Sufficient Compression: Look for charts where the squeeze dots have been active for roughly 5 to 6 consecutive periods, a common rule of thumb rather than a fixed requirement. A single dot represents temporary stalling; prolonged compression indicates significant stored energy.
Wait for the Release (The Fire): Do not enter while the squeeze dots are active. Wait for the first period where the dot changes state from compressed (black or red) to released (gray or green).
Verify Directional Momentum: Confirm that the histogram matches the breakout direction. For a long entry, the squeeze release must coincide with histogram bars expanding above zero (Bright Green). For a short entry, look for bars expanding below zero (Bright Red).
Anchor Invalidation to Market Structure: Never place a stop-loss using an arbitrary dollar amount or fixed tick offset. Your stop-loss must be placed beyond the opposite boundary of the pre-squeeze consolidation range. If price violates the entire consolidation base, the breakout premise is completely invalid.
Manage Risk and Scale Out: As an illustrative example, many traders size a position so the structural stop-loss risks no more than 0.5% to 1.0% of account capital. Set your own limit based on your firm’s rules and your risk tolerance. When the histogram prints its first deceleration bar (Bright Green turning to Dark Green, or Bright Red turning to Dark Red), a common approach is to scale out about 50% of the position and trail the stop to breakeven to help protect your daily drawdown limit. These figures are examples, not fixed rules.
Analytical Tool
Core Operating Function
Volatility Measurement
Funded Account Drawdown Risk
Squeeze Momentum Indicator
Identifies compression cycles and directional rate-of-change
Mathematical overlay of Standard Deviation vs. ATR
Moderate; premature entries inside chop can bleed daily loss limits
Standard Bollinger Bands
Measures price dispersion around an arithmetic mean
Standard deviation only (dynamic width)
High; bands lack an ATR baseline to confirm true relative compression
Relative Strength Index (RSI)
Measures internal price momentum on a normalized 0–100 scale
None (ignores market volatility cycles)
High; oscillator values peg at extreme levels during powerful expansion runs
Common Mistakes and Traps When Trading the Squeeze
Traders consistently run into three behavioral and mechanical pitfalls when using the Squeeze Momentum Indicator under prop firm conditions.
Trap 1: Front-Running the Dot Release
The most frequent error is opening a position while the dots are still indicating an active squeeze. Traders observe a higher-timeframe trend and assume the compression must resolve in that direction. However, volatility compression can resolve in either direction regardless of the prior trend.
Price often sweeps liquidity on both sides of a tight range, meaning it briefly pokes past nearby highs and lows to trigger stop orders, before starting a true expansion. Entering prematurely forces you to sit through chop, absorb slippage, and endure stop-outs before the real move occurs.
Trap 2: Treating Deceleration as an Immediate Trend Reversal
A histogram shifting from bright green to dark green does not mean the market is reversing downward. It indicates that momentum is decelerating: price is rising at a slower pace or moving sideways into a brief resting pattern. Traders who immediately close their winning trades and flip short on the first dark bar often get run over when momentum re-accelerates. Treat deceleration as a trade management signal to secure partial profits, not as an automatic counter-trend entry.
Trap 3: Chasing News-Driven Volatility Spikes
Economic news releases (such as CPI prints or central bank rate decisions) cause instantaneous band expansion that triggers squeeze signals. Entering a trade immediately after a news candle fires the squeeze creates severe execution risks: spreads widen dramatically, limit orders suffer execution slippage, and mean-reverting wicks frequently retrace the entire move within seconds. Furthermore, many funded programs explicitly prohibit executing trades within minutes of high-impact macroeconomic data. Let news volatility settle before assessing whether a structural squeeze setup exists.
Using the Squeeze Momentum Indicator as a Volatility Filter
The Squeeze Momentum Indicator provides an objective framework for trading market volatility cycles. It identifies when price volatility is compressing, waits for energy to release, and measures the directional velocity of the resulting move. For funded traders managing strict daily and maximum loss limits, using the indicator as a volatility filter can help you stay disciplined during unprofitable chop while providing clear confirmation rules for structured breakouts.
FAQ
What are the standard settings for the Squeeze Momentum Indicator?
The standard settings use a 20-period lookback with 2.0 standard deviations for Bollinger Bands, alongside a 20-period Keltner Channel with a 1.5 Average True Range multiplier. These default inputs are a common starting point that balances signal frequency and noise, though the best settings vary by asset and timeframe. While scalpers occasionally lower the ATR multiplier to 1.0 for faster alerts, altering baseline parameters can increase false breakout signals.
What is the difference between John Carter’s TTM Squeeze and LazyBear’s Squeeze Momentum?
John Carter developed the original TTM Squeeze as a proprietary trading tool, whereas LazyBear created an open-source TradingView script modeled after Carter's core logic. Both detect when Bollinger Bands contract inside Keltner Channels. However, the two versions come from different places and can differ in calculation details, visuals, and alert features, so check the documentation for the version you use.
Can the Squeeze Momentum Indicator be used on any timeframe?
Yes, the indicator functions across all chart intervals, from 1-minute intraday charts to daily candles. However, lower timeframes produce more frequent squeeze conditions with higher rates of false breakouts and execution slippage. Higher timeframes such as the 15-minute, 1-hour, and 4-hour charts tend to filter out more intraday noise, but no timeframe removes false breakouts.
Does the Squeeze Momentum Indicator predict the direction of a breakout?
No. The squeeze dots measure volatility compression exclusively, indicating that price is coiling for a potential move without revealing directional bias. Direction is determined solely by the momentum histogram once the bands expand outside the channels. Traders must wait for the histogram to expand above or below zero and confirm higher-timeframe market structure before selecting a directional bias.
Why do some platforms display different colored dots for the squeeze?
Color configurations vary by platform and code version. In LazyBear's TradingView indicator, black dots along the zero line represent an active squeeze, gray dots signal a release, and blue dots mean no squeeze is present. In John Carter’s traditional TTM Squeeze, red dots signify that the squeeze is on, and green dots indicate that it has fired.
How should funded traders handle a squeeze release during high-impact news?
Funded traders should avoid trading squeeze releases triggered immediately by high-impact macroeconomic news releases. Data releases like CPI or interest rate decisions cause instantaneous band expansion, but they also trigger wider spreads, slippage, and sharp mean-reversion wicks. Furthermore, many prop firms restrict opening trades within several minutes of major scheduled news announcements.
Disclaimer
Disclaimer: This guide was written with AI assistance, reviewed for accuracy by the Proptary editorial team, and kept up to date. It's for education only — not financial advice. Prop trading and the financial markets carry a significant risk of loss, so consider your own situation and consult a licensed advisor before you trade.
Proptary editorial team independently reviews prop trading firms, verifies payouts, and explains the rules that decide who keeps an account. We disclose affiliate relationships and publish methodology for every score.