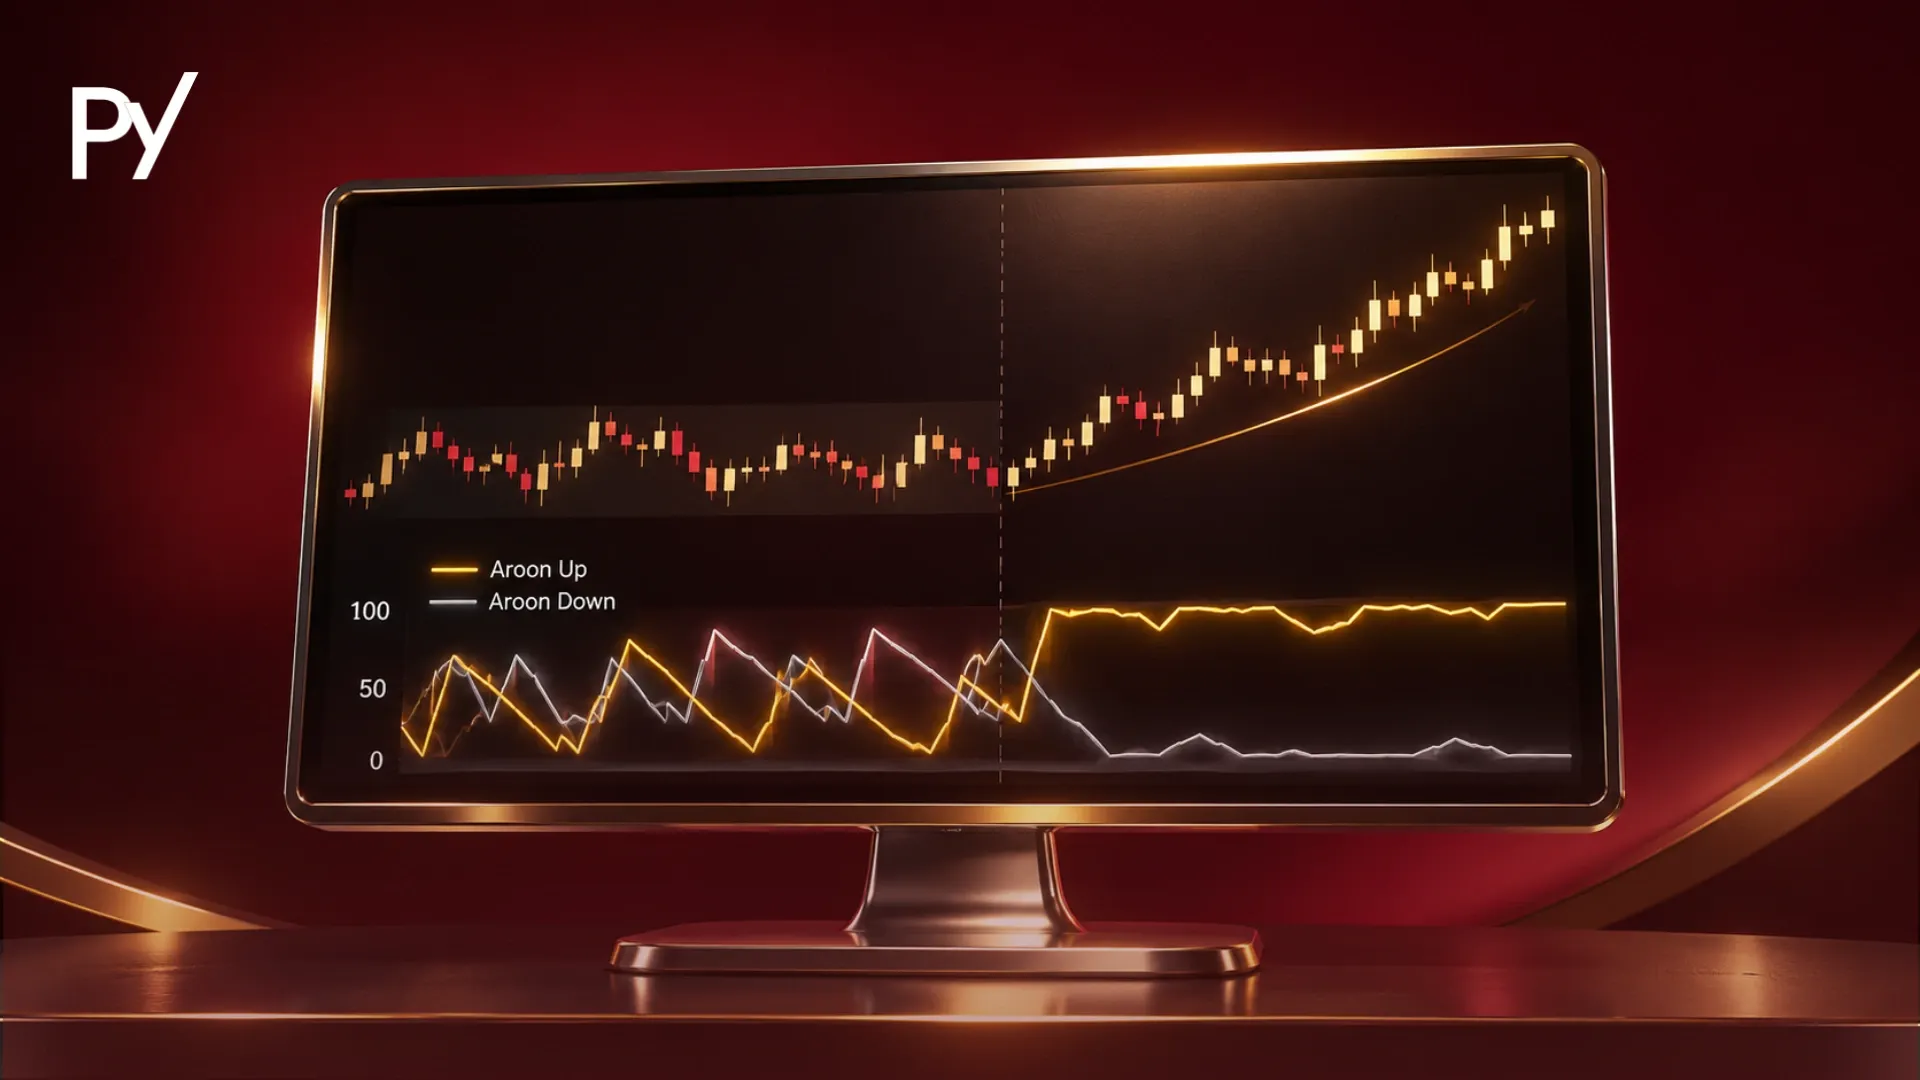
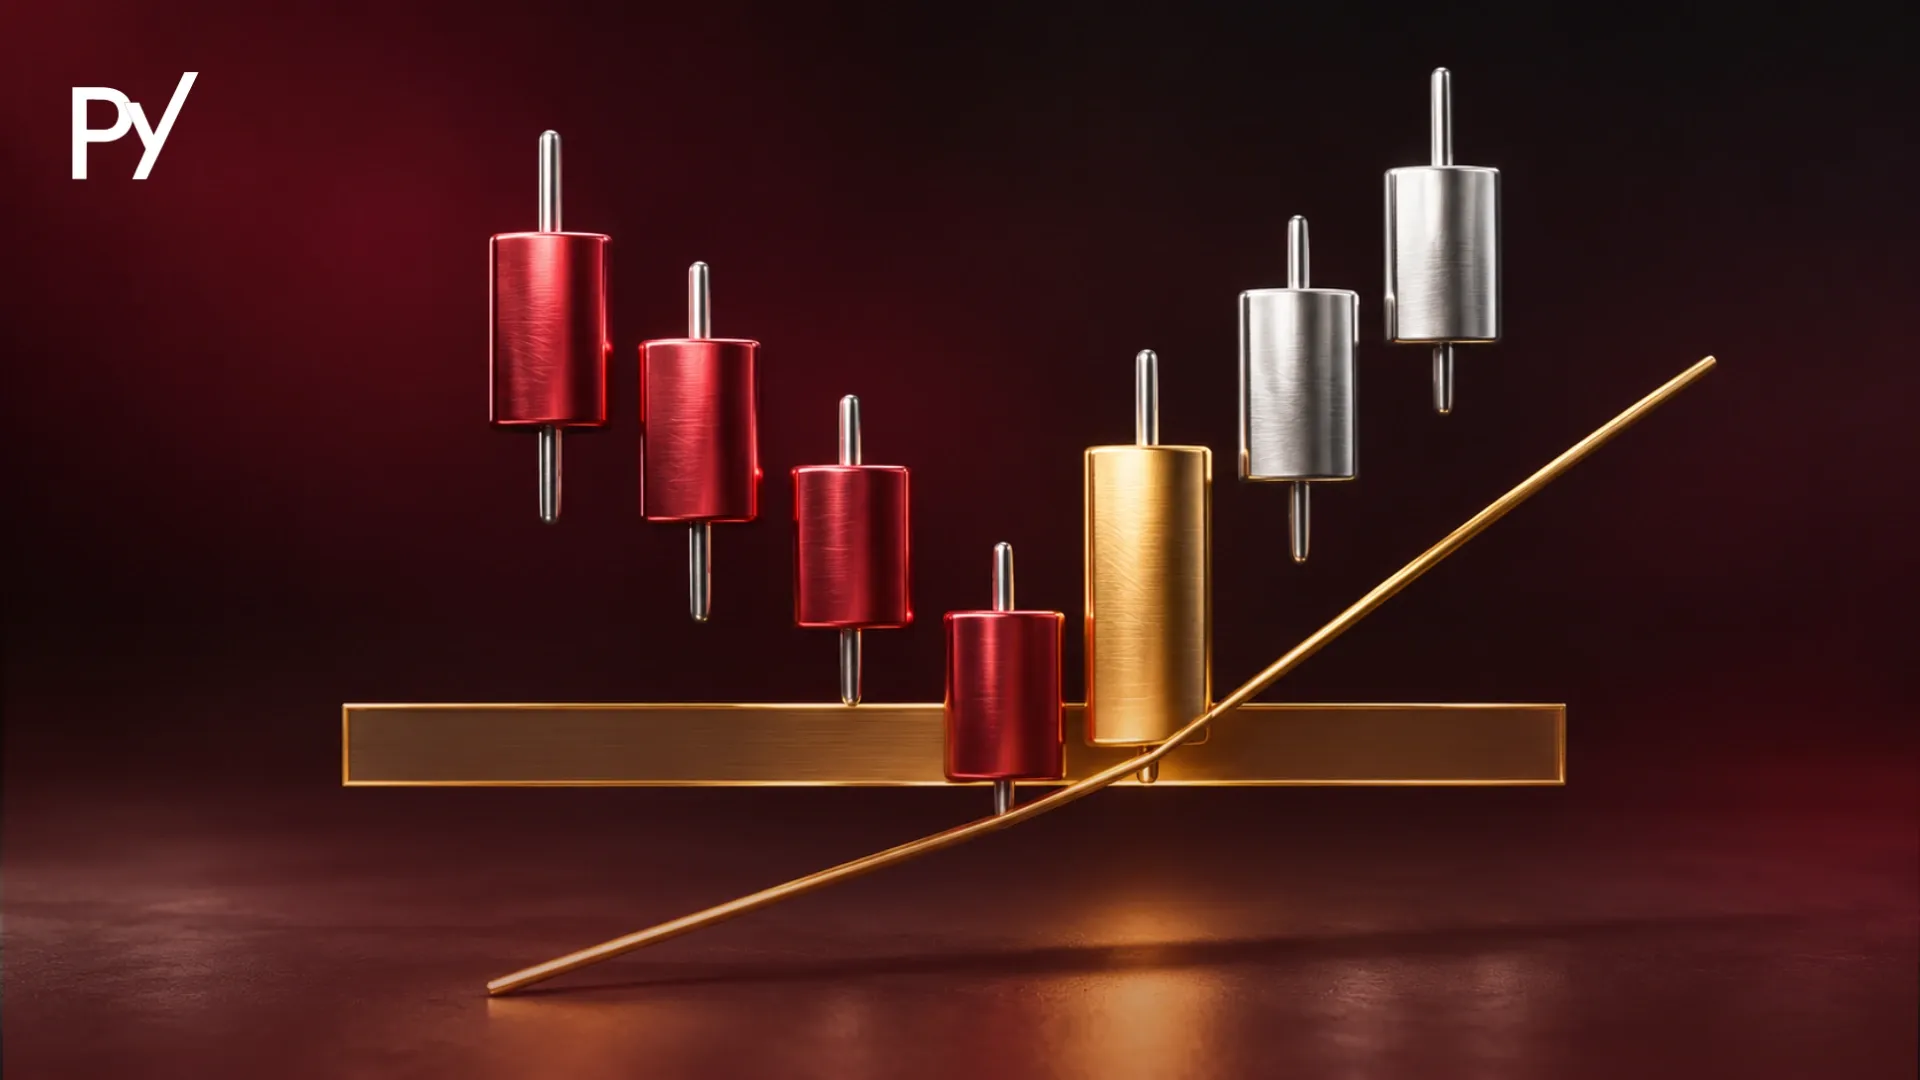
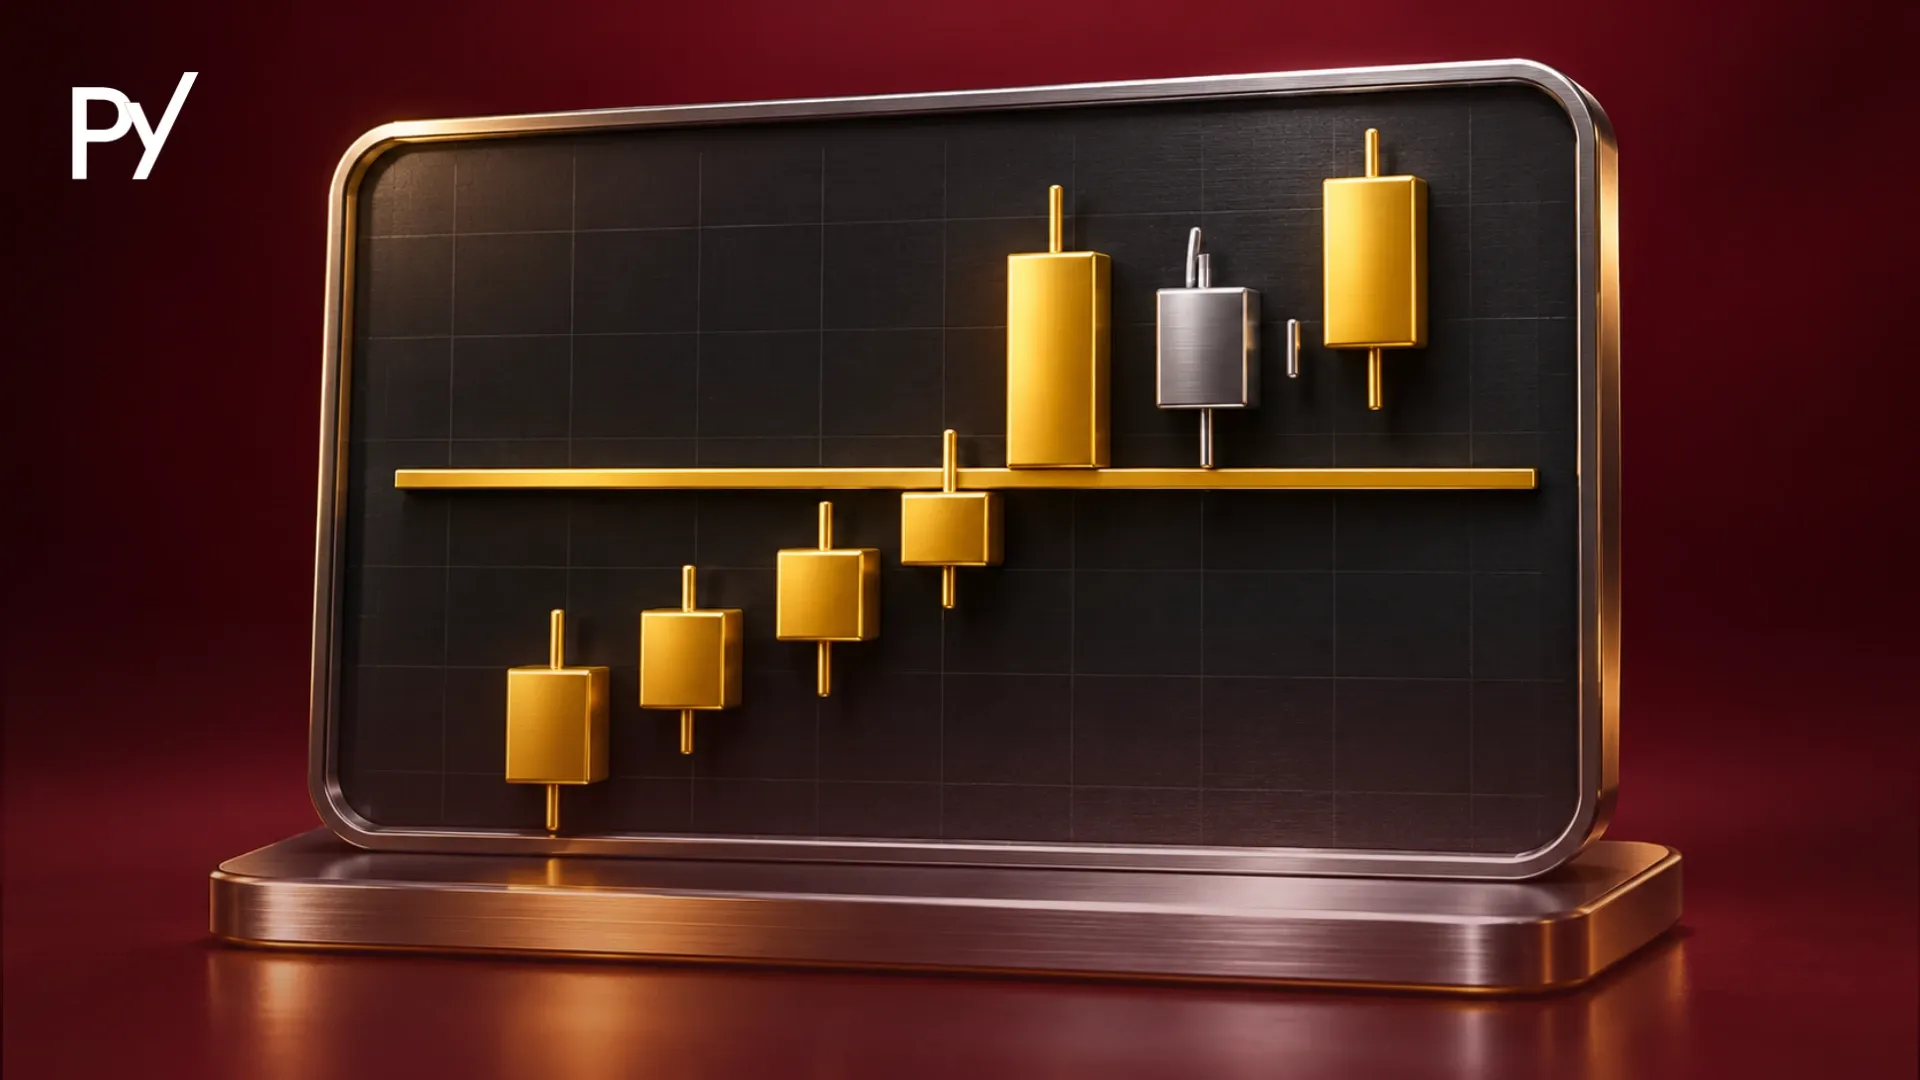
Higher highs and higher lows are a sequence of rising price peaks and troughs that define an uptrend, showing buyers stepping in at higher levels. In a funded account, the most recent higher low gives you an objective stop-loss anchor for sizing within daily drawdown limits. A close below that higher low invalidates the uptrend.
Higher highs and higher lows are a sequence of rising price peaks and troughs that define an uptrend, showing that buyers are consistently stepping in at higher price levels than before.
In a funded account, spotting that sequence too late often leads to buying an extended breakout right before a normal pullback breaches your daily loss limit. Understanding what higher highs and higher lows mean lets you anchor stop-losses to real structure and size positions around tight prop drawdown rules. This guide breaks down how to read the pattern, time entries, and spot structural breaks before they end your challenge.
What Are Higher Highs and Higher Lows?
Higher highs and higher lows are consecutive price swings in which each new rally peak (higher high) climbs above the previous peak, and each downward pullback trough (higher low) holds above the previous trough. Together, these two points form the structural footprint of an uptrend across forex, futures, equities, and crypto markets.
Understanding higher highs and higher lows meaning comes down to supply and demand at key turning points. When price rallies to a peak and pulls back, sellers briefly take control. If buyers step back in before price drops to the prior trough (and then push price past the previous peak) you have objective proof that demand is absorbing supply at progressively higher prices.
Not every market environment produces this staircase pattern, and recognizing when structure is absent keeps you from forcing trades in choppy conditions:
Uptrend (HH / HL): Price prints rising peaks and rising troughs, favoring long setups aligned with upward order flow.
Downtrend (LH / LL): Price prints lower highs and lower lows, showing that sellers are defending rallies and pushing price through support.
Consolidation or range: Price bounces between roughly equal highs and equal lows, offering no directional trend edge.
Keep in mind that higher highs and higher lows are lagging structural observations of completed price swings. Seeing three consecutive higher highs confirms what buyers have already done: it never guarantees the fourth swing will continue upward.
How Higher Highs and Higher Lows Work on a Price Chart
Higher highs and higher lows form through a repeating three-part cycle: an upward impulse leg, a corrective pullback that establishes a higher low, and a breakout push that clears the previous peak to confirm a new higher high.
To map this accurately, you first need to identify valid turning points on your chart rather than reacting to every minor candle fluctuation. Each peak and trough in the sequence is a confirmed swing high and swing low: a clear pivot where price reversed direction with noticeable displacement away from the turning point. Once you connect those pivots in chronological order, the market's structural direction becomes visible without adding lagging indicators.
Here is how the sequence builds step by step on a live chart:
Impulse leg (Initial High): Price rallies strongly from a base and stalls where sellers step in, creating your reference swing high.
Corrective pullback (Higher Low): Price retraces part of that rally on lighter momentum, then finds buyers above the starting point of the first leg.
Continuation breakout (Higher High): Price pushes back up and closes above the initial swing high, confirming both the higher low behind it and the new higher high ahead.
Timeframe alignment determines whether a sequence holds up. A clean set of higher highs and higher lows on a 15-minute execution chart can actually be a routine upward retracement inside a dominant 4-hour downtrend. When that 15-minute uptrend runs straight into a 4-hour lower high, higher-timeframe sellers often overwhelm local buyers and snap price back down. Checking one timeframe above your execution chart helps you verify whether your local uptrend has room to run or is heading into major overhead supply.
Why Higher Highs and Higher Lows Matter in a Funded Account
In a prop firm evaluation or funded account, higher highs and higher lows act as an objective risk-sizing framework that keeps routine market pullbacks from breaching your daily or maximum drawdown limits.
Unlike trading a personal brokerage account where you can tolerate a 15% drawdown and wait months for recovery, prop accounts operate under strict loss thresholds. Most evaluation models enforce a 4% to 5% daily loss limit alongside an 8% to 10% maximum drawdown cap. When you embed higher highs and higher lows into your broader market structure trading plan, every trade receives a structural invalidation point before you click buy.
That invalidation point sits just below the most recent confirmed higher low. If price drops below that trough, the uptrend thesis is wrong: and you want out immediately rather than hoping for a bounce.
More importantly, the distance from your entry price down to that higher low controls your position size:
Suppose you trade a $100,000 funded account with a 5% ($5,000) daily loss limit and cap your per-trade risk at 0.5% ($500).
If your entry is 25 pips above the prior higher low, you can trade 2.0 standard lots on EUR/USD ($20 per pip × 25 pips = $500 risk).
If you chase an extended rally and enter 50 pips above that same higher low, you must cut your position size in half to 1.0 standard lot to keep the exact same $500 dollar risk.
Ignoring swing distance is how prop traders blow challenges while reading the trend direction correctly.
Entering on Higher Lows vs. Chasing Higher Highs
Waiting for price to pull back toward a developing higher low generally produces tighter stop-losses, stronger reward-to-risk ratios, and lower drawdown exposure than buying breakouts at new higher highs.
Both entry methods use the exact same trend structure, yet they expose your funded account to very different risks. Buying as price breaks above a prior peak gives you immediate confirmation that a new higher high is printing, but your structural stop-loss still belongs beneath the prior higher low: often far below your entry. Buying during a pullback toward the higher low places your entry right next to your invalidation point, though you accept the risk that a strong trend may run without filling your order.
Evaluation Factor
Pullback Entry (Near Higher Low)
Breakout Entry (At New Higher High)
Stop-Loss Distance
Tight—placed just below the developing or confirmed higher low
Wide—must span the entire impulse leg back to the prior higher low
Prop Drawdown Exposure
Low—small adverse excursion before structural invalidation triggers
High—normal post-breakout retracements create heavy unrealized drawdown
Primary Trade Risk
Missing the move if price rockets higher without a deep pullback
Buying the top of an impulse leg right before a corrective rotation
Behavioral Trap Triggered
Hesitation or trying to catch a falling knife before support holds
FOMO chasing after seeing large green breakout candles
Even when you wait patiently for a higher low, placing your stop-loss to the exact pip or tick below the prior trough leaves you vulnerable to liquidity sweeps. Institutional order flow frequently pushes price briefly below an obvious higher low to trigger clustered retail stop orders before reversing upward. Giving your stop a modest volatility buffer (such as 0.5 to 1.0 Average True Range (ATR) below the swing trough) helps keep normal stop-hunting wicks from knocking you out of a valid trend while still preserving a hard exit if the level truly breaks.
When the Sequence Breaks: Spotting Trend Reversals Before Drawdown Hits
An uptrend sequence breaks when price fails to establish a new higher high and subsequently closes below the most recent higher low, signaling that sellers have overpowered buyer control.
Trend reversals rarely happen without warning. Before the final higher low gives way, price action usually displays subtle signs of exhaustion that tell you to tighten risk or stop adding new long positions:
Shrinking impulse legs: Each new higher high clears the previous peak by a smaller margin, showing that buyers are struggling to attract follow-through volume.
Deepening pullbacks: Retracements begin eating away 70% to 80% of the prior rally instead of bouncing cleanly from shallow 38.2% to 50% zones.
Failure swing (Lower High): Price rallies off a higher low, stalls beneath the previous peak, and turns downward: creating a lower high before support even breaks.
When price then drives through and closes below the last higher low, the structural sequence has officially shifted. In a funded account, this is the exact moment to exit any remaining long exposure. Widening your stop-loss or averaging down after a higher low breaks turns a controlled 0.5% loss into a multi-percent drawdown hole that takes days of disciplined trading to recover.
Common Mistakes Funded Traders Make With HH/HL Structure
Most funded-account losses tied to trend structure come not from misreading basic peaks and troughs, but from three recurring execution and behavioral errors.
FOMO chasing extended higher highs: Entering long after three or four consecutive impulse legs without a meaningful pullback leaves you buying near trend exhaustion. When price finally reverts to build a higher low, your position absorbs maximum adverse excursion right into your daily loss limit.
Anchoring to a broken higher low: Traders often refuse to exit when an execution-timeframe higher low breaks because the daily chart "still looks bullish." Holding a losing position past structural invalidation violates basic risk discipline and exposes your account to sudden cascade selling.
Confusing micro-noise with real structure: Trying to map higher highs and higher lows on a 1-minute chart during low-liquidity sessions (such as the late New York close or early Asian session) produces endless false breaks. Valid structure requires genuine session liquidity and clear displacement between swings.
Conclusion
Higher highs and higher lows give you a clear, rules-based way to read buyer control without cluttering your charts with lagging indicators. When you anchor your stop-loss beneath a valid higher low and size your position to match that distance, you align every trade with your prop firm's daily and maximum drawdown limits. Most importantly, respecting a close below the prior higher low keeps a single failed trend from ending your funded account. Once you master reading upward swing sequences on your execution chart, your next step is learning how uptrends, downtrends, and structural shifts fit together in market structure trading.
Disclaimer: This guide was written with AI assistance, reviewed for accuracy by the Proptary editorial team, and kept up to date. It's for education only — not financial advice. Prop trading and the financial markets carry a significant risk of loss, so consider your own situation and consult a licensed advisor before you trade.
Disclaimer
This guide was written with AI assistance, reviewed for accuracy by the Proptary editorial team, and kept up to date. It’s for education only, not financial advice. Prop trading and the derivatives markets carry a significant risk of loss, and past performance is not a guarantee of future results. Consider your own situation and consult a licensed advisor before you trade.
Proptary editorial team independently reviews prop trading firms, verifies payouts, and explains the rules that decide who keeps an account. We disclose affiliate relationships and publish methodology for every score.