Power of 3 (PO3) is an ICT framework that splits a session or daily candle into three phases: Accumulation, Manipulation, and Distribution (AMD). Price ranges near the open, sweeps resting stops to form the wick, then expands in its true direction. For funded traders, waiting for the Manipulation phase to finish helps avoid stop-outs that strain daily drawdown limits.
Power of 3 (PO3) is an Inner Circle Trader (ICT) price-action framework that divides a trading session or daily candlestick into three sequential phases: Accumulation, Manipulation, and Distribution (AMD).
You've probably watched price spike right through your stop-loss at the session open, only to reverse immediately and sprint toward your original target without you. Inside a funded account, those sharp fakeouts don't just sting: they threaten tight daily drawdown limits. This guide breaks down how the AMD cycle builds a daily candle, how to navigate each phase without tripping prop firm rules, and how to size trades around session volatility.
What Is the Power of 3 ICT Meaning?
The Power of 3 ICT meaning comes down to a three-stage model (Accumulation, Manipulation, and Distribution) used to interpret how large market participants build positions, trigger resting liquidity, and drive directional price expansion within a single trading cycle.
If you're asking what is Power of 3 ICT in practical terms, it's an analytical lens for reading order flow and candlestick anatomy rather than a mechanical law that dictates how markets must move. While ICT theory frames price delivery around algorithmic liquidity seeking, real-world price action remains probabilistic and never guarantees a clean reversal. Treating PO3 as a structured hypothesis (rather than a certainty) keeps you from over-leveraging when market conditions turn erratic.
The framework maps directly onto the four components of an OHLC (Open, High, Low, Close) daily candlestick:
Open: Price opens near a key reference level, such as the New York midnight open (00:00 EST), establishing the baseline for the day's range.
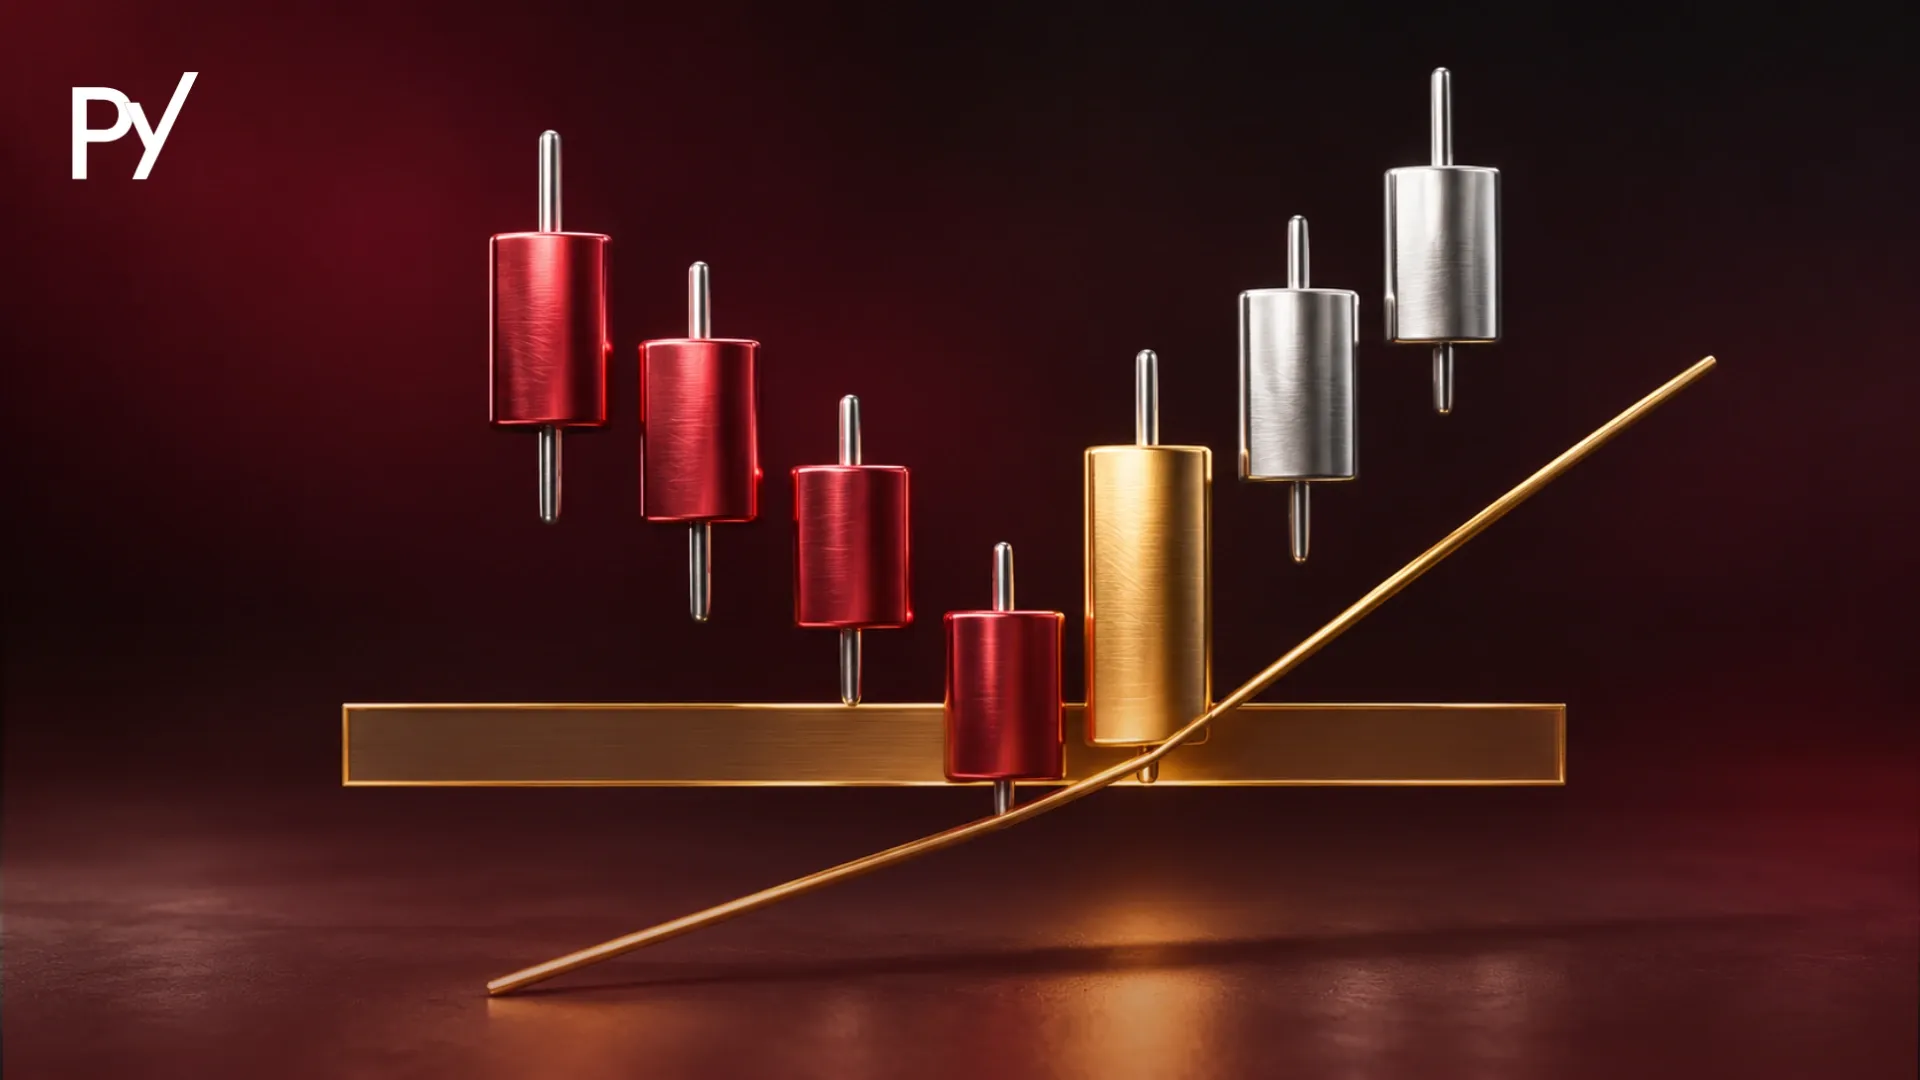
Wick (Accumulation & Manipulation): Price consolidates tightly around the open, then makes a deceptive push in the opposite direction of the eventual daily trend to form the candle's lower wick (on a bullish day) or upper wick (on a bearish day).
Body (Distribution): Once opposing orders are absorbed, price expands cleanly in the true directional bias, creating the thick body of the daily candle.
Close: Price settles near the opposite extreme of the daily range as session volume tapers off.
Within a broader ICT trading strategy, Power of 3 acts as the overarching daily roadmap. Tools like fair value gaps, order blocks, and liquidity sweeps provide the lower-timeframe entry triggers, while PO3 tells you which part of the daily candle you're currently trading inside.
How Does the Power of 3 Cycle Work Across Trading Sessions?
Power of 3 unfolds sequentially across global trading sessions, with each phase tied to distinct shifts in trading volume, spread width, and resting stop-loss liquidity.
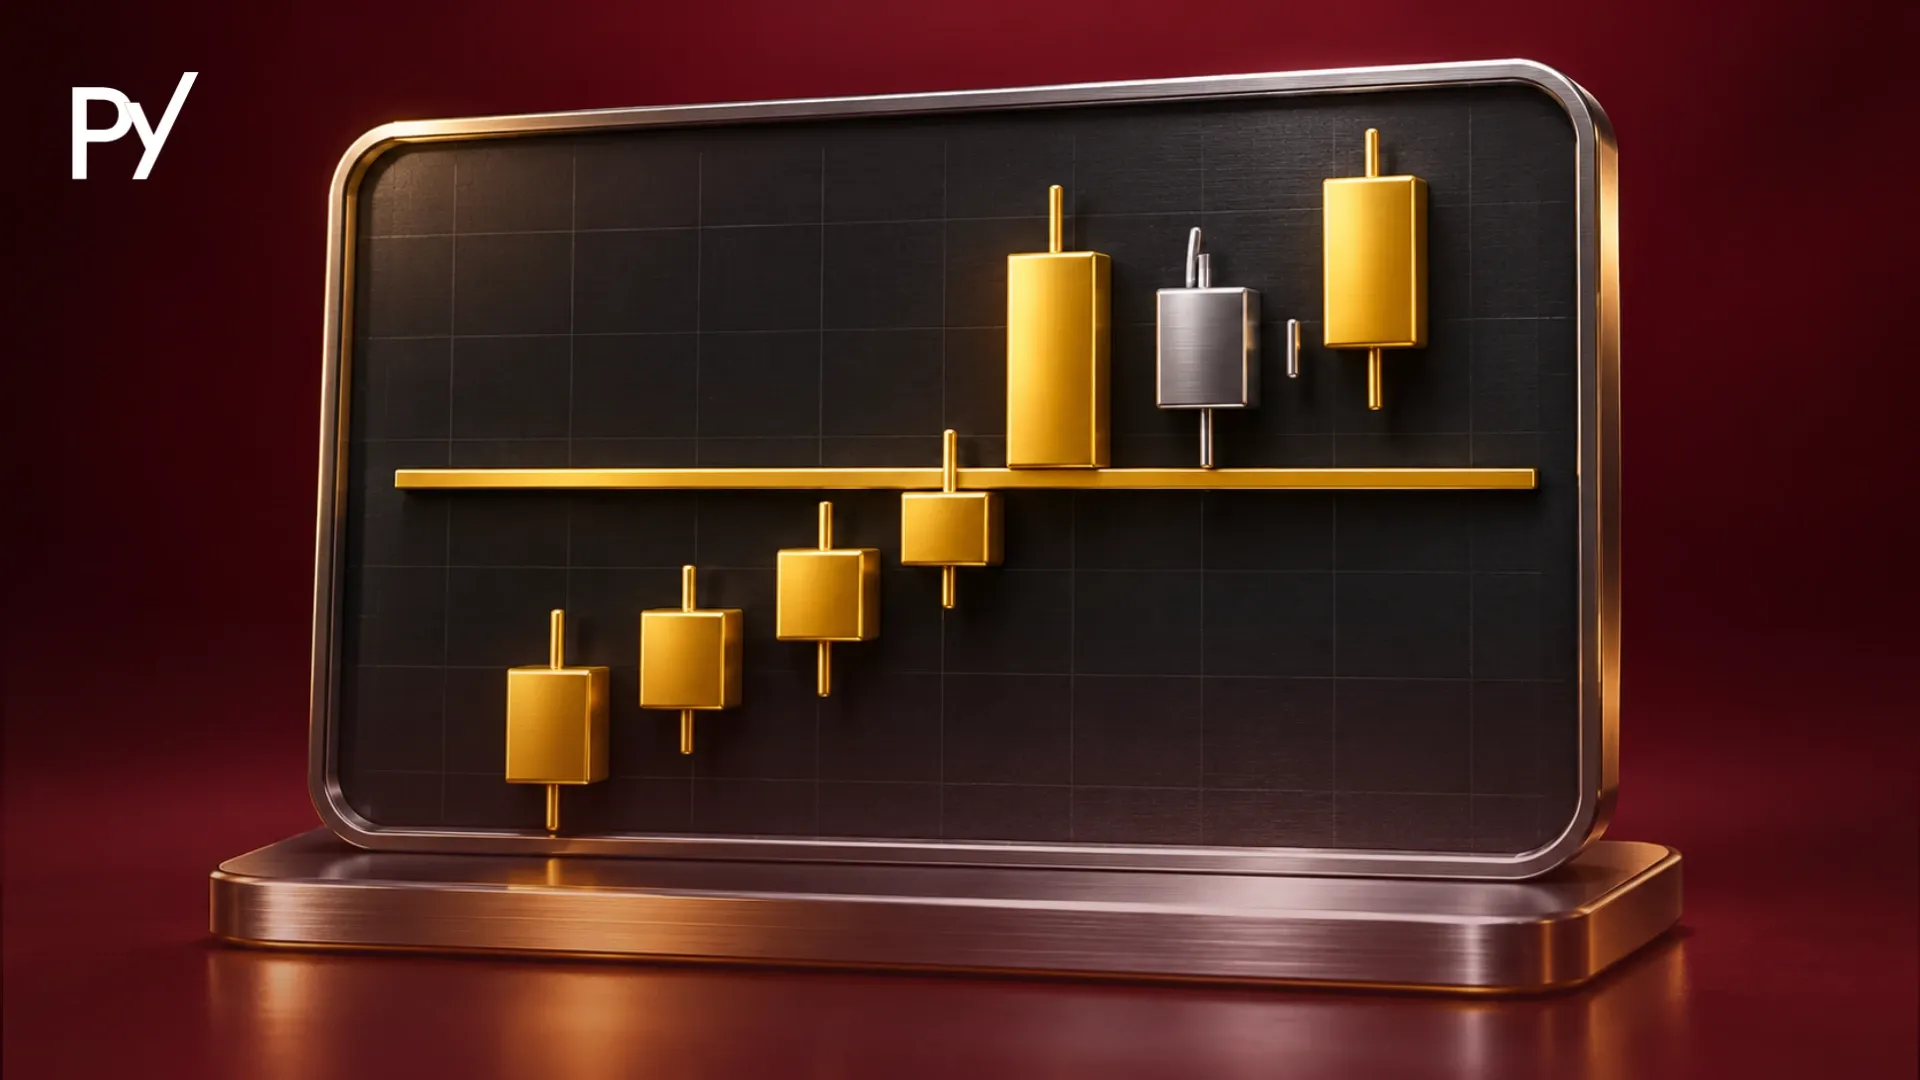
Accumulation (Consolidation): During low-volume periods (most commonly the Asian session or pre-market hours) price moves sideways inside a narrow, well-defined range. Because neither buyers nor sellers force a breakout, retail stop-losses and breakout orders stack up just above the range high (buy-side liquidity) and just below the range low (sell-side liquidity).
Manipulation (The False Breakout): As liquidity surges at the London open (03:00 EST) or New York open (08:00–09:30 EST), price breaks sharply beyond one side of the Accumulation range. ICT traders often call this move the "Judas Swing." It triggers stop-losses from range traders and lures breakout traders onto the wrong side of the market, providing the counterparty liquidity larger players need to fill sizable orders.
Distribution (Directional Expansion): After sweeping the liquidity pool, price reverses back through the Accumulation range and trends decisively toward opposing higher-timeframe liquidity levels. This phase delivers the bulk of the session's directional range and represents the primary window where prop traders aim to capture clean risk-to-reward setups.
Why Power of 3 Matters for Funded Traders
Power of 3 matters in a funded account because while it helps you avoid chasing false session-open breakouts, its Manipulation phase generates the exact kind of sudden volatility that breaches strict prop firm risk rules.
When you trade personal capital, getting stopped out on a session-open spike is a routine cost of doing business. Inside a prop firm evaluation or funded account, that same price behavior collides directly with three rulebook constraints:
Daily Drawdown & Trailing Equity Locks: Most two-step evaluations enforce a 4% to 5% daily loss limit, and many futures or one-step programs use an intraday trailing drawdown that tracks unrealized equity highs. Entering prematurely during Accumulation or trying to fade an unconfirmed Manipulation spike exposes your account to fast wick expansions and widened spreads that can wipe out your daily buffer in minutes.
High-Impact News Restrictions: Manipulation sweeps frequently occur alongside major economic releases like CPI, Non-Farm Payrolls (NFP), or FOMC rate decisions. Numerous prop firms prohibit opening or closing trades within 2 to 5 minutes of red-folder news events. Executing a textbook PO3 entry right as a news release triggers the Manipulation wick can result in a hard rule breach or voided payout, even if the trade finishes in profit.
Consistency Rules on Distribution Days: Catching an entire Distribution trend from the session open to the close can produce an unusually large single-day gain. On firms that enforce a 20% to 40% consistency rule, one outsized Distribution win can temporarily lock your payout eligibility until you complete additional trading days to smooth out your profit share.
How to Execute Power of 3 Inside a Funded Account
Trading Power of 3 safely inside a funded account requires matching your entry confirmation and position size to the specific phase currently unfolding on your chart.
Stay flat; mark range highs, lows, and the 00:00 EST open
2. Manipulation
London Open (03:00 EST) or NY Open (08:00–09:30 EST)
Sharp spike beyond range boundary; triggers stops and traps breakout entries
High (severe slippage, wide stops, news-rule exposure)
Wait for the sweep to exhaust and print a structure shift
3. Distribution
NY Morning / Overlap (09:30–12:00 EST)
Sustained directional expansion away from the manipulation extreme
Low to Moderate (cleaner momentum, clear invalidation point)
Enter on retracement after confirmation; manage partials
Follow these four steps to apply the framework within prop firm risk limits:
Establish Higher-Timeframe Bias First: Before dropping to a 15-minute or 5-minute execution chart, determine whether the daily and 4-hour charts favor higher or lower prices using market structure trading. If the higher timeframe is bearish, look for a Manipulation spike above the Accumulation range before shorting Distribution lower.
Mark the Midnight Open and Accumulation Range: Plot the New York midnight open (00:00 EST) on your chart and box in the tight pre-session consolidation. This gives you objective boundaries so you aren't guessing where resting liquidity sits.
Wait for Manipulation Plus a Market Structure Shift: Never step in front of a moving Manipulation candle. Wait for price to sweep the Accumulation high or low, reject that level, and break a minor swing point back inside the range: confirming that order flow has shifted toward Distribution.
Size for the Wider Stop Distance: Because your stop-loss belongs behind the extreme of the Manipulation wick, your stop distance in pips or ticks will often be wider than usual. Adjust your lot or contract size downward so a full stop-out risks no more than 0.5% to 1% of your funded account balance: leaving plenty of cushion beneath your firm's daily drawdown cap.
Common Power of 3 Mistakes That Blow Prop Firm Challenges
Most traders fail prop firm challenges with Power of 3 not because the concept is flawed, but because they try to predict the Manipulation leg instead of waiting for Distribution confirmation.
Catching a Falling Knife During Manipulation: Trying to fade a high-velocity breakout the moment it crosses an Accumulation boundary is one of the fastest ways to rack up consecutive losses. If a macroeconomic catalyst or institutional order flow is driving a genuine trend breakout rather than a fakeout, price will keep expanding without ever reversing.
Forcing the AMD Pattern onto Every Session: Not every trading day prints a textbook Accumulation, Manipulation, and Distribution sequence. Strong trend days often skip Accumulation altogether and expand straight from the open, while range-bound days stall before Distribution ever develops. Hindsight bias makes PO3 look effortless on historical charts, so you need a hard cap on daily attempts when real-time price refuses to confirm.
Ignoring Session Rollover Spreads: Placing tight stops right on the edge of an Asian range during the transition into London or New York exposes you to temporary spread widening. Even if price never actually reaches your stop level on the mid-price chart, an expanded ask or bid spread can clip your order and count against your daily drawdown.
Conclusion
ICT Power of 3 gives you a structured way to interpret how Accumulation, Manipulation, and Distribution shape a daily candle, helping you avoid chasing deceptive breakouts at the session open. Inside a funded account, your edge comes from patience: letting the Manipulation sweep clear out resting liquidity and waiting for a confirmed structure shift before risking capital on Distribution. Keep your position size calibrated to the wider stop distance behind the manipulation wick, and respect news-trading buffers and daily drawdown limits above every setup. Because Power of 3 only works when your directional bias aligns with the broader trend, your next step is mastering higher-timeframe market structure trading.
Disclaimer: This guide was written with AI assistance, reviewed for accuracy by the Proptary editorial team, and kept up to date. It's for education only — not financial advice. Prop trading and the financial markets carry a significant risk of loss, so consider your own situation and consult a licensed advisor before you trade.
FAQ
What time is the ICT Power of 3 cycle most active?
The ICT Power of 3 cycle typically aligns with major forex and index session transitions in New York time (EST). Accumulation generally forms during the quiet Asian session between 19:00 and 02:00 EST. Manipulation often occurs at the London open around 03:00 EST or the New York open between 08:00 and 09:30 EST, followed by Distribution during the high-volume New York morning session from 09:30 to 12:00 EST.
What is the Judas Swing in ICT Power of 3?
The Judas Swing is the ICT term for the Manipulation phase of the Power of 3 cycle. It describes a sharp, deceptive price spike beyond the Accumulation range—usually at the London or New York open—that moves opposite to the true daily trend. This false breakout triggers stop-losses from range traders and lures impatient breakout traders into bad entries right before price reverses into Distribution.
Which timeframes should you use for ICT Power of 3?
Most traders combine higher and lower timeframes to apply Power of 3 effectively. You use the daily and 4-hour charts to identify higher-timeframe market structure, liquidity pools, and directional bias, while watching the daily candle form its open and wick. Once session liquidity is swept, you drop to the 15-minute or 5-minute chart to spot a confirmed market structure shift and refine your entry.
Does ICT Power of 3 work on futures, forex, and indices?
Yes, Power of 3 is a price-action concept that traders apply across forex pairs, stock index futures like NQ and ES, and commodities such as gold. Because the framework relies on session volume shifts and resting stop-loss liquidity rather than a specific asset formula, it appears on any liquid market with clear session opens. However, exact accumulation and manipulation windows vary depending on each market's primary trading hours.
Does the ICT Power of 3 pattern happen every single trading day?
No, Power of 3 does not form cleanly every single day, and treating it as a guaranteed daily rule leads to forced trades. On strong macroeconomic trend days, price may expand immediately from the session open without printing an Accumulation range or Manipulation sweep. On low-volume holiday or pre-news days, price may stay trapped in Accumulation all session without ever delivering a Distribution leg.
Disclaimer
This guide was written with AI assistance, reviewed for accuracy by the Proptary editorial team, and kept up to date. It’s for education only, not financial advice. Prop trading and the derivatives markets carry a significant risk of loss, and past performance is not a guarantee of future results. Consider your own situation and consult a licensed advisor before you trade.
Proptary editorial team independently reviews prop trading firms, verifies payouts, and explains the rules that decide who keeps an account. We disclose affiliate relationships and publish methodology for every score.