RSI indicator buy and sell signals are momentum readings that flag overbought levels above 70 and oversold levels below 30 on a 0–100 scale. A buy signal occurs when the oscillator crosses back above 30; a sell signal occurs when it drops back below 70. In funded accounts, they need structure confirmation to avoid counter-trend entries that breach drawdown limits.
RSI indicator buy and sell signals are momentum readings calculated on a 0–100 scale to show when an asset is overbought, oversold, or losing directional speed.
A common way funded traders lose evaluation accounts is by treating these readings as automatic reversal orders and buying oversold dips during aggressive market downtrends. This guide explains how RSI signals work, how to calibrate settings for different styles, and how to filter entries so you protect your daily loss limit.
What Are RSI Buy and Sell Signals?
RSI buy and sell signals are quantitative momentum alerts generated by the Relative Strength Index to highlight when price movement has reached statistical extremes or lost velocity.
Developed by J. Welles Wilder Jr., the Relative Strength Index measures the speed and magnitude of recent price changes over a set lookback window. The formula evaluates the average price gains against average losses, mapping the resulting momentum value onto a fixed scale between 0 and 100.
Because the indicator derives entirely from historical price data, it is a lagging indicator rather than a predictive forecasting model. It does not tell you where the market will travel next. Instead, it measures how aggressively buyers or sellers pushed price over past sessions.
The scale centers around a 50 baseline, known as the centerline. Readings above 50 demonstrate that average gains exceed average losses, establishing an upward momentum bias. Readings below 50 reflect net selling pressure. Traditional technical analysis treats readings above 70 as "overbought" conditions and readings below 30 as "oversold" conditions, though these static numbers mean very little without broader trend context.
How RSI Indicator Buy and Sell Signals Work
RSI indicator buy and sell signals trigger through three primary price-oscillator behaviors: threshold crossovers, centerline shifts, and momentum divergences.
Understanding how each signal forms prevents you from entering positions prematurely while momentum remains stacked against you.
1. The Threshold Crossover (Re-entry Rule)
A common beginner mistake is executing an order the second the RSI line crosses outside the 70 or 30 boundaries. Touching 30 does not mean price must bounce. In institutional liquidation events, assets can plunge lower for hours while the oscillator sits below 20.
The mechanical signal occurs only when the oscillator exits the extreme zone and crosses back into the neutral range:
Buy Signal: The RSI drops below 30 into oversold territory, stabilizes, and subsequently crosses back above 30. This indicates that aggressive selling pressure has paused and buyers are regaining short-term traction.
Sell Signal: The RSI climbs above 70 into overbought territory, stalls, and subsequently crosses back below 70. This signals that buying momentum has waned and profit-taking or short pressure is taking control.
2. Centerline Crossovers (Level 50)
The 50 level represents the equilibrium line between bullish and bearish momentum. Centerline crossovers serve as trend-continuation confirmations rather than top-or-bottom reversal triggers:
Bullish Momentum Trigger: Crossing above 50 confirms expanding upside velocity, often used to validate trend-following entries.
Bearish Momentum Trigger: Crossing below 50 indicates that sellers have overwhelmed buyers, confirming downward trend continuation.
3. Bullish and Bearish Divergence
Divergence happens when price action and the RSI oscillator move in opposing directions, revealing an underlying disconnect between price expansion and actual trade velocity.
Regular Bullish Divergence: Price prints a lower low, but the RSI prints a higher low. This demonstrates that while price reached a lower absolute level, the selling force behind the move was weaker than the previous drop. It frequently precedes an upward correction or reversal.
Regular Bearish Divergence: Price prints a higher high, but the RSI prints a lower high. Even though buyers pushed price to a new peak, internal velocity decelerated. This warns that upside exhaustion is setting in.
Why RSI Signals Matter for Funded Traders
RSI signals carry amplified operational risk for funded traders because standard counter-trend oscillator techniques run directly into prop firm drawdown constraints.
When you trade personal capital, you can theoretically endure temporary floating drawdown if your leverage is low. In a funded account, you operate under rigid risk ceilings. Many prop firms set a maximum daily loss limit, commonly a few percent of the starting balance or equity, alongside an overall drawdown limit. The exact limits and how they are calculated vary by firm and program, and some programs do not use a daily limit at all, so check the rules for your account.
A major threat to a challenge account using momentum oscillators is RSI Pinning. During an institutional trend extension or macroeconomic news release, an asset's RSI can remain pinned below 30 or above 70 for extended stretches. If you treat 30 as a concrete buy wall, you end up buying falling knives. Adding to losing positions as the indicator sinks deeper into single digits can breach your daily drawdown limit before the market stages a relief rally.
To survive under prop rules, you must overcome anchoring bias. Retail traders anchor psychologically to the numbers 30 and 70, assuming an asset is "cheap" or "expensive". In high-volume markets, overbought conditions can reflect strong buying pressure that sometimes continues higher. Treating RSI as a permission slip to fade strong trends can lead to account termination.
Calibrating RSI Indicator Settings for Different Trading Styles
The standard lookback period for the RSI is 14 bars, but adjusting your rsi indicator settings alters the balance between signal speed and market noise.
The lookback parameter determines how many historical periods the formula processes. A shorter lookback increases indicator volatility, while a longer lookback smooths the line.
Day Trading and Scalping Configurations
If you day trade index futures or intraday forex pairs, a 14-period RSI on a 1-minute or 5-minute chart often lags rapid intraday turns. Lowering the lookback period to 7 or 9 increases responsiveness.
However, faster settings cause the oscillator to swing erratically into extreme zones. To reduce false signals that whip you out of positions, you can widen your overbought and oversold thresholds to 80 and 20. This can help you flag only moves with larger statistical displacement, although wider thresholds also produce fewer and later signals.
Swing Trading and Multi-Day Holds
Traders managing multi-day swings inside two-step funded accounts face trailing drawdown locks that punish mid-week volatility. Extending the lookback to 21 or 25 periods smooths out intraday spikes, which can produce cleaner divergences on 4-hour and daily charts.
Dynamic Thresholds (Trend Adjustments)
In persistent trending environments, static 70/30 levels become unreliable. Technical analyst Constance Brown established that true momentum ranges shift based on underlying market regime:
Bull Market Range: The RSI oscillator tends to oscillate between 40 and 80. The 40–50 zone acts as dynamic support for pullbacks, while 80 represents temporary exhaustion. Buying when RSI bounces from 40 aligns you with the dominant trend.
Bear Market Range: The RSI oscillator typically oscillates between 20 and 60. The 50–60 zone acts as dynamic overhead resistance. Selling when RSI rejects the 60 level is one way traders look for trend-aligned entries, but it does not guarantee a reversal or a profitable trade.
Trading Style
Lookback Period
Threshold Levels
Drawdown Advantage
Primary Risk
Scalping / Fast Intraday
7 – 9
80 / 20
Rapid alerts on sudden volume spikes
High rate of false crossovers (whipsaws)
Standard Intraday Settings
14 (Default)
70 / 30
Balanced baseline with moderate noise filtration
Can lag volatile market open reversals
Swing Trading
21 – 25
70 / 30
Filters market noise on high timeframes
Slower trigger requires larger stop losses
Dynamic Trend Following
14
80 / 40 (Bull), 60 / 20 (Bear)
Prevents counter-trend fading in strong regimes
Fails when market enters a tight consolidation
Execution Strategy: Combining RSI Signals with Technical Confluence
Never execute an order in a funded account based solely on an RSI signal.
High-performing traders demand confluence, requiring the oscillator's reading to align with structural price levels before risking capital.
Pairing Divergence with Market Structure Shifts
An RSI divergence indicates waning momentum, but momentum can stall long before price actually turns. To avoid catching falling knives, wait for price action to confirm the divergence through a Market Structure Shift (MSS):
Identify a regular bullish divergence on your execution timeframe (e.g., price prints a lower low while RSI prints a higher low).
Identify the most recent swing high, which is the last peak price formed just before it dropped to the final lower low.
Refrain from buying while the divergence forms. Wait for a candle to close decisively above that swing high, confirming that buyers have taken control from sellers.
Enter on the subsequent retracement, placing your protective stop loss below the newly established structural swing low.
Confluence with Fibonacci Retracements
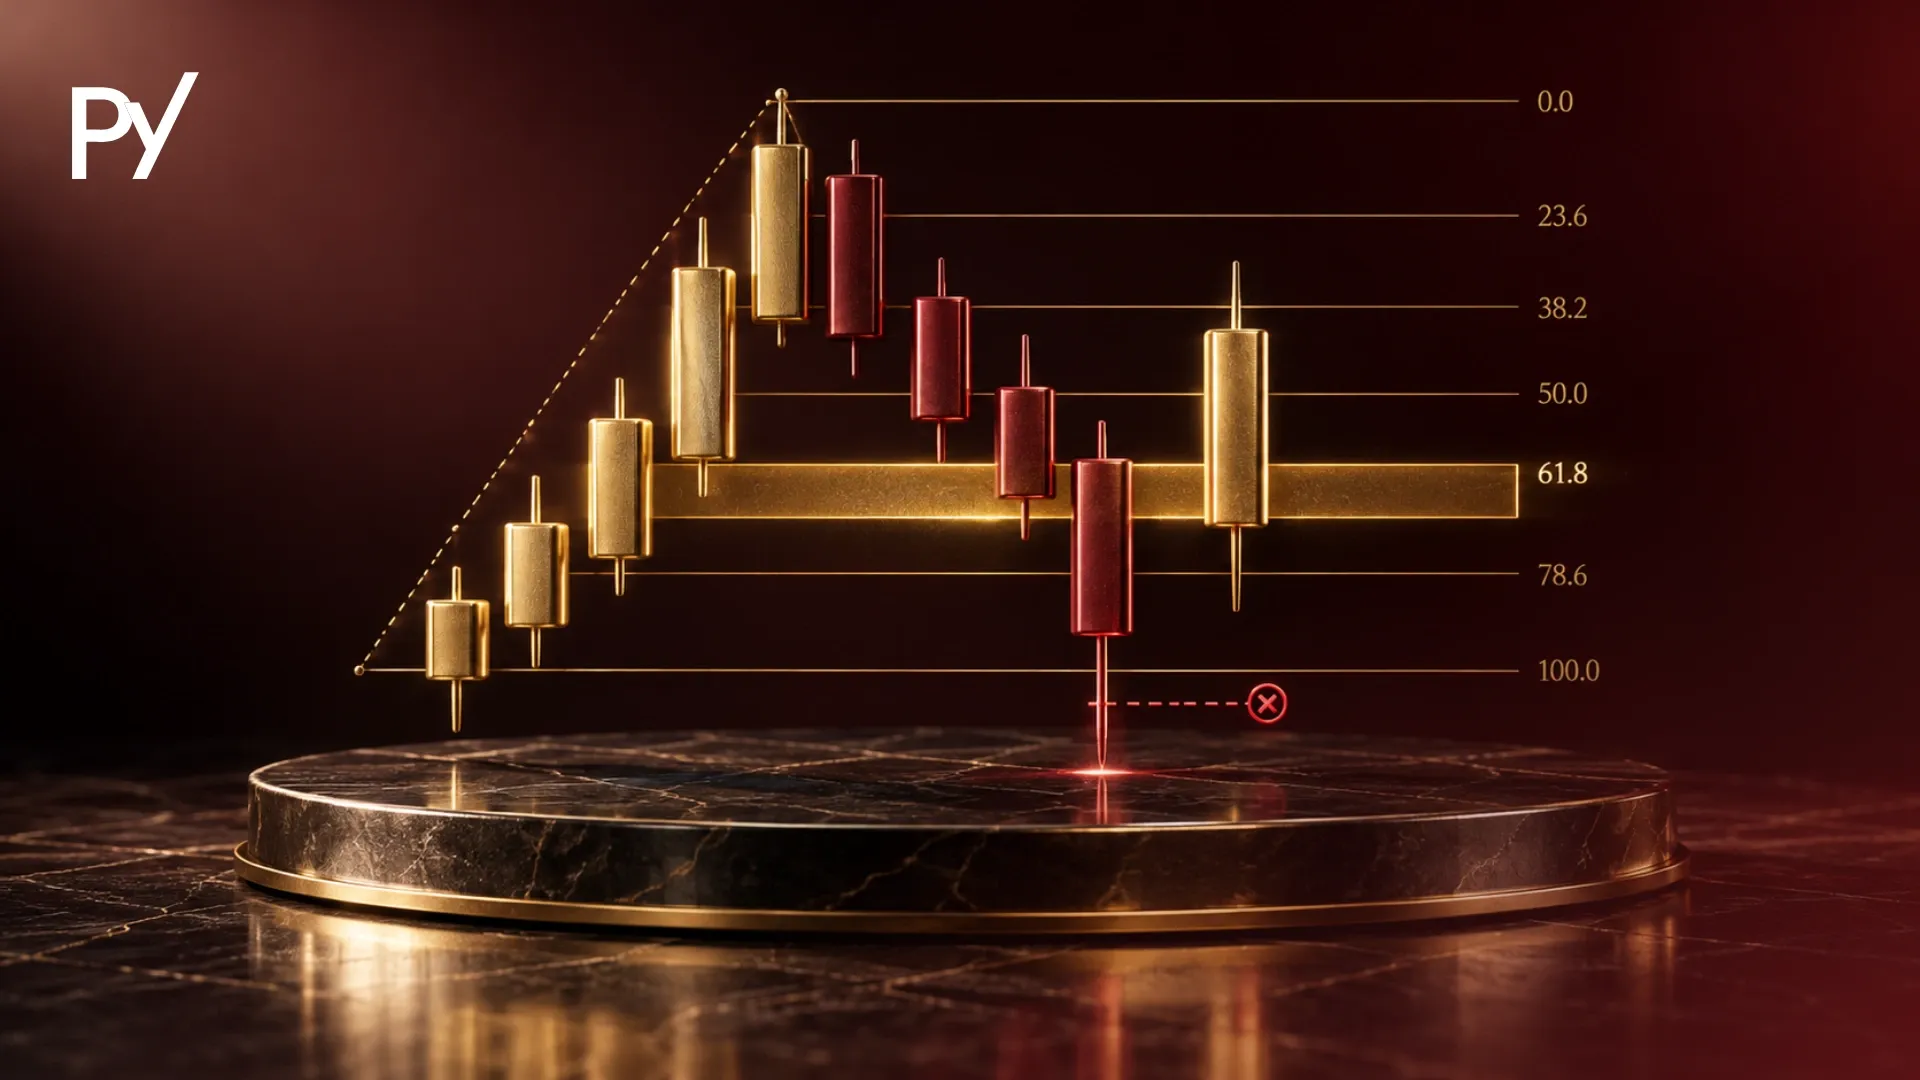
Combining momentum resets with retracement levels can help you find clearer setups and may reduce drawdown exposure, although no combination of indicators removes the risk of loss. If you are unfamiliar with calculating these zones, our breakdown on what is fibonacci retracement explains how to draw these retracement levels on a chart.
When price pulls back into the 61.8%–78.6% Fibonacci retracement zone while the RSI touches the 40 level (in an uptrend) or forms a bullish divergence, you have two independent technical frameworks pointing to trade exhaustion. This structural overlap may allow you to use tighter stops that help you stay within your evaluation limits, although tighter stops can also be hit more often.
3 Costly Mistakes Traders Make with RSI Signals
Traders repeatedly sabotage their prop trading careers by misinterpreting oscillator mechanics and mismanaging position sizing.
1. The Falling Knife Trap
A risky habit among retail traders is treating oversold readings as guaranteed bounce zones. When institutional desks dump inventory, price can drop through multiple support levels with little pause. The RSI can pin at 15–20 for dozens of candles.
Buying into this liquidity vacuum can trigger your prop firm's daily maximum loss limit long before any recovery occurs. Always wait for the oscillator to climb back above 30 before considering an entry.
2. Multi-Timeframe Ignorance
Taking an RSI buy signal on a 5-minute chart while the 4-hour chart is breaking down into a major bearish expansion is a losing strategy. Low-timeframe oversold readings are routinely steamrolled by higher-timeframe trend momentum. Use higher-timeframe charts (1-hour or 4-hour) to establish directional bias, and only take lower-timeframe RSI signals that align with that overarching direction.
3. Martingale Sizing on Multiple Divergences
Divergence can persist across multiple successive price swings. A market can form a double or triple divergence, printing three lower lows while the RSI prints three higher lows. Traders who scale up their contract size on each failed bounce to "average out" their entry risk violating maximum trailing drawdown rules. Accept that an unconfirmed divergence is simply a warning, not a mandate to overleverage your account.
How to Use RSI Buy and Sell Signals with Confirmation
The Relative Strength Index can be a useful tool for gauging market velocity, identifying momentum exhaustion, and filtering trade setups, although no indicator works every time. However, static 70 and 30 levels are not trade triggers on their own. To protect your funded account, you must wait for crossovers back into the active range, adapt your lookback settings to the prevailing market regime, and demand structural price confirmation before risking your balance.
Mastering oscillator momentum is only the first step in building a resilient strategy, so broaden your systematic edge by mastering our full library of core technical indicators.
Disclaimer: This guide was written with AI assistance, reviewed for accuracy by the Proptary editorial team, and kept up to date. It's for education only — not financial advice. Prop trading and the financial markets carry a significant risk of loss, and past performance does not guarantee future results, so consider your own situation and consult a licensed advisor before you trade.
FAQ
What is the best RSI setting for day trading in a funded account?
For day trading and scalping, lowering the lookback period to 7 or 9 increases signal responsiveness on fast charts. However, to reduce premature entries caused by market noise and to protect strict daily loss limits, pair this faster lookback with wider overbought and oversold thresholds of 80 and 20. This can filter out some minor fluctuations, although wider thresholds also produce fewer and later signals.
How do you confirm an RSI buy signal before entering a trade?
Rather than buying immediately when the RSI touches 30, wait for two stages of confirmation. First, let the indicator cross back above the 30 threshold to show that selling momentum is subsiding. Second, wait for a lower-timeframe market structure shift, such as a decisive candle close above the most recent swing high. This confirms that buyers are actively stepping into the market.
Can RSI stay oversold for an extended period?
Yes. During strong institutional downtrends or liquidation events, the Relative Strength Index can remain pinned below 30 for dozens of candles. This condition, known as RSI pinning, is dangerous for prop traders because buying into sustained selling pressure can trigger maximum daily loss or trailing drawdown breaches before an actual price reversal occurs.
What is the difference between regular and hidden RSI divergence?
Regular divergence signals a potential trend reversal: price prints a lower low while the RSI prints a higher low, indicating that selling momentum is exhausting. In contrast, hidden divergence signals trend continuation: price prints a higher low while the RSI prints a deeper low, indicating that a pullback has reset oscillator momentum without breaking the dominant higher-timeframe trend structure.
Does the RSI indicator work effectively across all timeframes?
The mathematical formula functions on any timeframe, but lower timeframes like the 1-minute or 5-minute chart produce frequent false signals due to market noise. Many funded traders use the 1-hour or 4-hour chart to establish overall market bias and trend direction, executing on lower-timeframe RSI signals only when they align with that higher-timeframe context.
Disclaimer
Disclaimer: This guide was written with AI assistance, reviewed for accuracy by the Proptary editorial team, and kept up to date. It's for education only — not financial advice. Prop trading and the financial markets carry a significant risk of loss, so consider your own situation and consult a licensed advisor before you trade.
Proptary editorial team independently reviews prop trading firms, verifies payouts, and explains the rules that decide who keeps an account. We disclose affiliate relationships and publish methodology for every score.